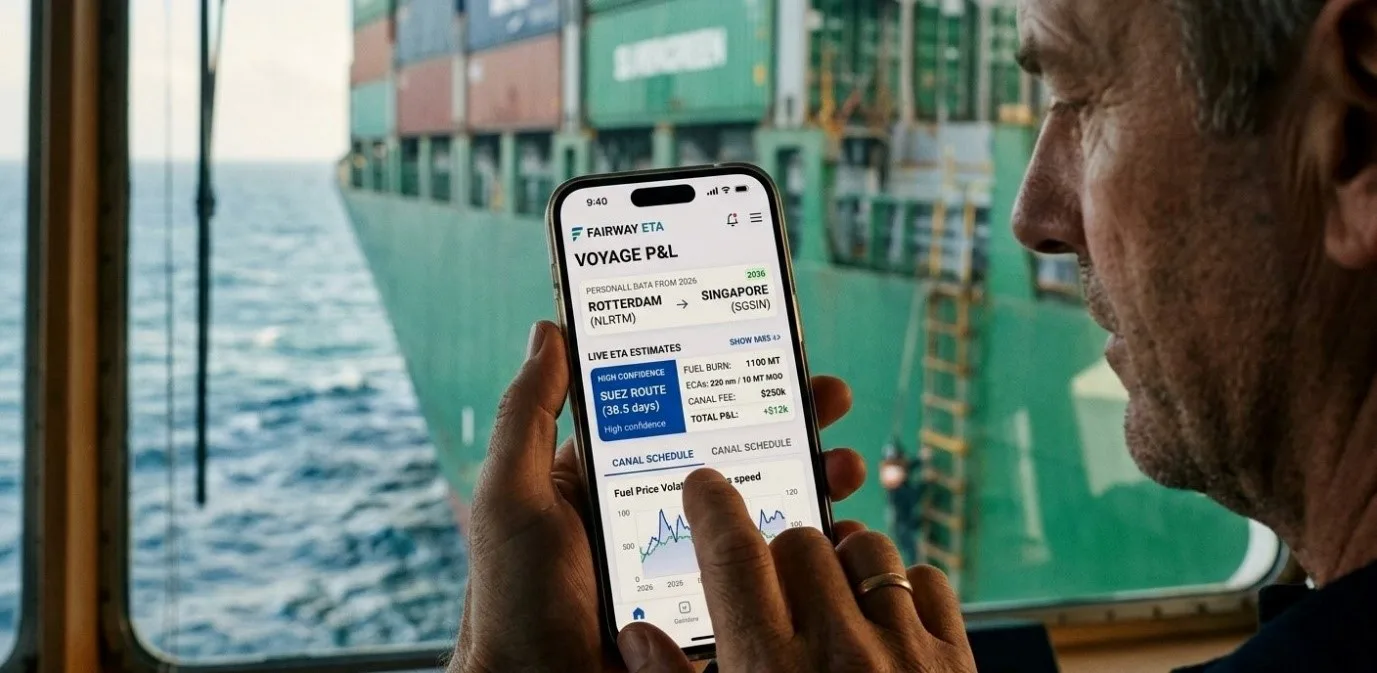
Estimated Time of Arrival (ETA) calculation sits at the heart of commercial shipping operations. From charterers planning laycans to port agents coordinating berth windows, accurate ETA forecasting affects millions of dollars in voyage economics. This guide explains how modern ETA calculation works, what variables matter most, and how to avoid the common mistakes that cost operators time and fuel.
What is Ship ETA?
Ship ETA is the predicted arrival time of a vessel at its destination port, expressed in UTC or local time. While it sounds simple, accurate ETA prediction requires combining vessel performance data, weather routing, canal scheduling, port approach times, and fuel constraints into a single coherent estimate.
A poorly calculated ETA can result in demurrage charges, missed laycan windows, unnecessary fuel burn, or anchorage waiting time. Demurrage is negotiated per fixture and broadly tracks the vessel's earning power — for a Panamax, that has meant somewhere near $18,000 a day through mid-2026, moving with the freight market. Current Baltic indices are on our Data Hub.
ETA is not one number
Ask three people for a vessel's ETA and you may get three different answers, all correct. The port agent quotes one time, the charterer's system shows another, and the AIS feed displays a third that the second officer typed in two days ago and has not revisited since.
This is not sloppiness. Until recently the industry had no agreed vocabulary for the different arrival times a single voyage produces. The IAPH/IHMA Port Call Optimisation Guide, which took effect on 1 April 2026, standardised four of them across IMO member states:
- PTA — Planned Time of Arrival. The time the voyage was scheduled around when it was fixed. It comes from the fixture, not from the vessel, and it rarely survives contact with the sea.
- ETA — Estimated Time of Arrival. The vessel's own current estimate, calculated from position, speed, and remaining distance. This is the number this article is about, and it should move as conditions change.
- RTA — Requested Time of Arrival. The time the port asks the vessel to arrive, based on when a berth, a pilot, and the fairway will actually be available. This is the one most operators have never had access to.
- ATA — Actual Time of Arrival. What happened. Recorded after the fact, and the basis for every laytime calculation that follows.
The distinction that matters commercially is between ETA and RTA. ETA travels in one direction: the ship tells the port when it expects to arrive. RTA travels the other way, and it changes what the ship should do. If the berth will not be free until Thursday morning, arriving Tuesday night achieves nothing except three days of fuel burned to reach an anchorage.
The industry has a name for that pattern. Sail Fast Then Wait — steaming hard to protect against a port readiness you cannot see, then queueing on arrival. It is the default behaviour under first-come-first-served berth allocation, and it is expensive.
The IMO has measured what this costs. Optimising speed over the final twenty-four hours of a voyage saves an average of 5.9 percent of total voyage fuel; over the final twelve hours, 4.2 percent. A Port of Rotterdam trial covering twenty-six vessels at a single terminal reached comparable conclusions. Where full port call coordination is achieved — berth, pilot, tugs and fairway all aligned — the IMO's estimate rises to 20 percent per voyage.
Six percent of a voyage's fuel bill is worth having, and it comes from slowing down rather than from any capital expenditure. But capturing it requires knowing the RTA, and knowing the RTA requires the port to share it — which is what the 2026 guide is trying to make routine.
What you need before you can calculate anything
The six variables above determine how wrong your ETA will be. These five inputs determine whether you can produce one at all:
- Origin and destination ports — including pilot station coordinates, not just port center points. The pilot boarding ground can be 5–15 nautical miles offshore, and ignoring this adds hours of error to short voyages.
- Vessel speed — typically expressed in knots over ground. Most operators use a service speed (e.g., 14.5 knots for a Panamax), but real-world conditions reduce this by 5–15%.
- Departure time (ETD) — the moment the vessel clears the origin pilot station, not when it leaves the berth.
- Route selection — Suez vs Panama vs Cape vs NSR dramatically changes both distance and transit time.
- Canal availability — Suez and Panama operate on scheduled transits with booking windows. A vessel arriving at the Suez southern anchorage outside its convoy slot may wait 24–48 hours. Current canal fees are on our Data Hub.
Multi-Route Comparison: Why It Matters
Most legacy ETA calculators assume a single "best" route, usually the great-circle path. Real voyage planning requires comparing multiple viable routes because the shortest distance is rarely the cheapest or fastest in operational terms.
It is also rarely the same answer twice. A planner working the Gulf in 2025 and the same planner working it in 2026 face different maps, not different preferences. Live risk zone assessments are on our Data Hub.
Consider a voyage from Busan to Rotterdam:
| Route | Distance | Voyage | Notes |
|---|---|---|---|
| Suez Canal | ~10,500 nm | — | Canal fees + Red Sea risk |
| Cape of Good Hope | ~12,500 nm | — | Default for many trades since 2024 |
| NSR Arctic | ~7,500 nm | Summer only | Ice-class hull required |
Voyage time depends on the speed you actually plan to run. At 14 knots the Suez leg is about 31 steaming days; at 16 it is 27, but the cube law below means those four days cost roughly half again as much fuel per day. Run your own vessel profile through the calculator for figures you can put in a fixture.
A modern calculator should present all three side by side with distance, voyage time, fuel consumption, and total cost. Compare any route pair on the Fairway ETA calculator.
Fuel Consumption and ECA Zones
Fuel cost typically represents 50–70% of voyage operating costs, making accurate fuel projection essential to ETA economics. Two factors complicate the calculation:
Speed-fuel curve: fuel consumption rises roughly with the cube of speed. Reducing speed from 16 to 14 knots can cut fuel consumption by 30%, which often more than offsets the longer voyage time.
ECA (Emission Control Area) compliance: when transiting North America, North Sea, Baltic, or Mediterranean (effective May 2025) ECA zones, vessels must switch to ultra-low-sulfur fuel to meet the 0.1% sulphur limit — typically MGO, or HSFO burned through an exhaust gas cleaning system (scrubber). Outside ECAs, the global 0.5% sulphur cap (since IMO 2020) already requires VLSFO or scrubber-equipped HSFO. The additional ECA cost comes from the step down to 0.1%. The gap is not small and it does not hold still. Through mid-2026 MGO has run $600–750/MT above HSFO at the major hubs, roughly double the spread of two years ago — check live bunker prices across 45 ports before pricing any ECA-heavy voyage. Accurate ECA distance projections feed straight into voyage P&L.
The speed in the charter party is a promise, not an estimate
Both of those calculations start from a speed figure. It is worth knowing where that figure comes from.
A time charter does not describe the vessel's speed. It warrants it. A typical description clause reads something like:
Laden: about 13.0 knots on about 23.5 mt VLSFO plus about 0.2 mt LSMGO
Every word in that line has been argued in front of an arbitrator.
"About" is not vagueness. London arbitration convention reads it as a margin of roughly half a knot on speed and 5 percent on consumption. A vessel warranted at "about 13.0 knots" that averages 12.6 has not breached anything.
The warranty only applies in good weather, and good weather is defined in the contract. The standard formulation limits wind to Beaufort Force 4 — 11 to 16 knots — and significant wave height, combining sea and swell, to Douglas Sea State 3, meaning 0.5 to 1.25 metres. Most clauses add no adverse current and no negative influence of swell.
The consequence for anyone forecasting an ETA is direct. A performance claim is calculated only from the days that met the good weather definition, then extrapolated across the whole voyage. On a monsoon-season passage through the Indian Ocean there may be almost no qualifying days, which is exactly the argument owners make when charterers deduct from hire. In one recent London arbitration a charterer's weather routing company assessed good weather speed at 9.88 knots against a warranted 12.5; the owners' position was that no day on the passage had met the contractual definition at all.
So when this article says use realistic speed rather than nameplate, understand what the nameplate figure is. It is the speed the owner has promised to achieve in weather that may not occur on your voyage. For planning, apply your own margin. For a performance claim, the only speeds that count are the ones recorded on qualifying days.
Weather Routing
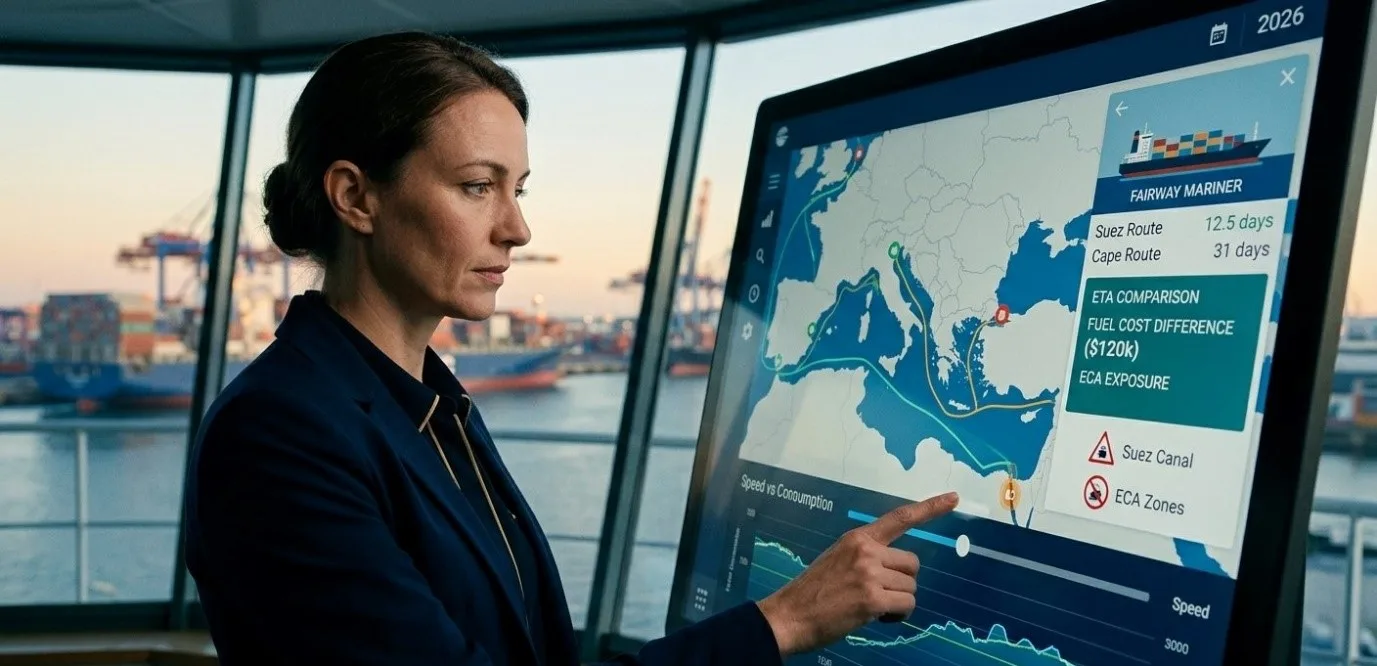
Headwinds, beam seas, and swell add resistance and reduce effective speed. Professional weather routing services adjust ETA based on forecasted conditions, but for most planning purposes, a 5–10% safety margin on transit time accounts for typical weather impact.
Seasonal patterns matter: a westbound North Pacific voyage in winter will face significantly higher resistance than the same route in summer.
Port congestion and berth availability
A vessel can complete a 25-day ocean passage with a perfect ETA and then spend three days at anchor waiting for a berth. Port congestion is the variable that calculators rarely model but operators always feel.
At major terminals — Singapore, Rotterdam, Fujairah, Houston — average waiting times range from 12 hours to 4 days depending on season, terminal capacity, and cargo type. Coal and iron ore terminals in China and India routinely see 5-10 day queues. LNG terminals with single-berth configurations can delay arrivals by a full week.
For ETA purposes, the practical response is to distinguish between "pilot station ETA" (when the vessel arrives at the port approach) and "berth ETA" (when cargo operations actually begin). Most commercial ETAs quote the pilot station arrival. The gap between the two is where demurrage charges accumulate.
Where the ETA meets the laytime clock
Waiting at anchor costs someone money. Which side depends on a document the vessel sends, not on the ETA itself.
Laytime — the time the charterer is allowed for cargo operations before demurrage begins — starts running when a valid Notice of Readiness has been tendered and accepted. Under a plain berth charter the vessel must actually be at the berth before NOR can be given. Every hour spent at anchorage before that is the owner's cost.
Charter parties routinely modify this, and the modifications are the abbreviations that appear in every fixture recap:
- WIBON — whether in berth or not. NOR can be tendered on arrival at the port even with no berth available. Congestion risk moves to the charterer.
- WIPON — whether in port or not. NOR can be tendered from the usual waiting place, before entering port limits.
- WIFPON — whether in free pratique or not. Removes health clearance as a prerequisite.
- WICCON — whether customs cleared or not. Removes the customs formality.
These clauses have limits. WIBON shifts commercial delay to the charterer, but not navigational delay: if the berth is free and the vessel cannot reach it because of weather, that remains the owner's risk. And NOR must be valid when given — the vessel physically and legally ready, holds prepared, documentation in order. An NOR tendered when the vessel is not ready does not start the clock, however confidently it is dated.
For ETA work the practical consequence is that arrival time and laytime commencement are two different events, and the distance between them is set by contract language rather than by navigation. A vessel that arrives at the pilot station at 0300 under a clause requiring NOR to be tendered during office hours does not start the clock until 0800 or later. Six hours, on a fixture where demurrage runs at the Panamax daily earnings rate, is real money.
The abbreviations are covered in more depth in our guide to charter party terms.
Tide windows and draft restrictions
Ports with shallow approach channels — Hamburg, Tianjin, Santos, Brisbane — restrict deep-draft vessel entry to specific tidal windows. A fully laden VLCC drawing 21 metres cannot enter a channel with a 19-metre charted depth until the tide provides sufficient clearance.
Missing a tide window by two hours can mean waiting 12 hours for the next one. For ports with semi-diurnal tides (two high tides per day), this adds half a day. For ports with diurnal tides (one per day), it adds a full day. Accurate ETA calculation for draft-restricted ports must account for tidal predictions at the destination — something most distance calculators ignore entirely.
Calculating ETA in Practice
The basic ETA formula is simple:
ETA = ETD + (Distance / Speed) + Canal Transit Time + Pilot Approach Time
But each component requires careful sourcing:
- Distance must come from a routing engine that respects landmasses, traffic separation schemes, and canal corridors — not a simple great-circle calculation.
- Speed should reflect actual vessel performance under expected conditions, not just nameplate service speed.
- Canal transit times include scheduled convoy windows: roughly 12–16 hours for Panama, 11–16 hours for Suez.
- Pilot approach can add 1–4 hours depending on the port.
Common Mistakes
Three mistakes appear repeatedly in operational ETA calculations:
- Using port center coordinates instead of pilot stations. This understates voyage time, especially for ports with long approach channels like Houston, Hamburg, or Tianjin.
- Ignoring canal scheduling. Treating Suez as a "free shortcut" without accounting for transit booking windows can mis-forecast ETA by a full day.
- Single-route thinking. Defaulting to the historical route without comparing alternatives. The Red Sea crisis pushed many trades toward the Cape from 2024; the closure of the Strait of Hormuz since February 2026 removed a corridor that was never treated as optional at all. Routes that were settled questions two years ago are open ones now.
What a modern calculator should do
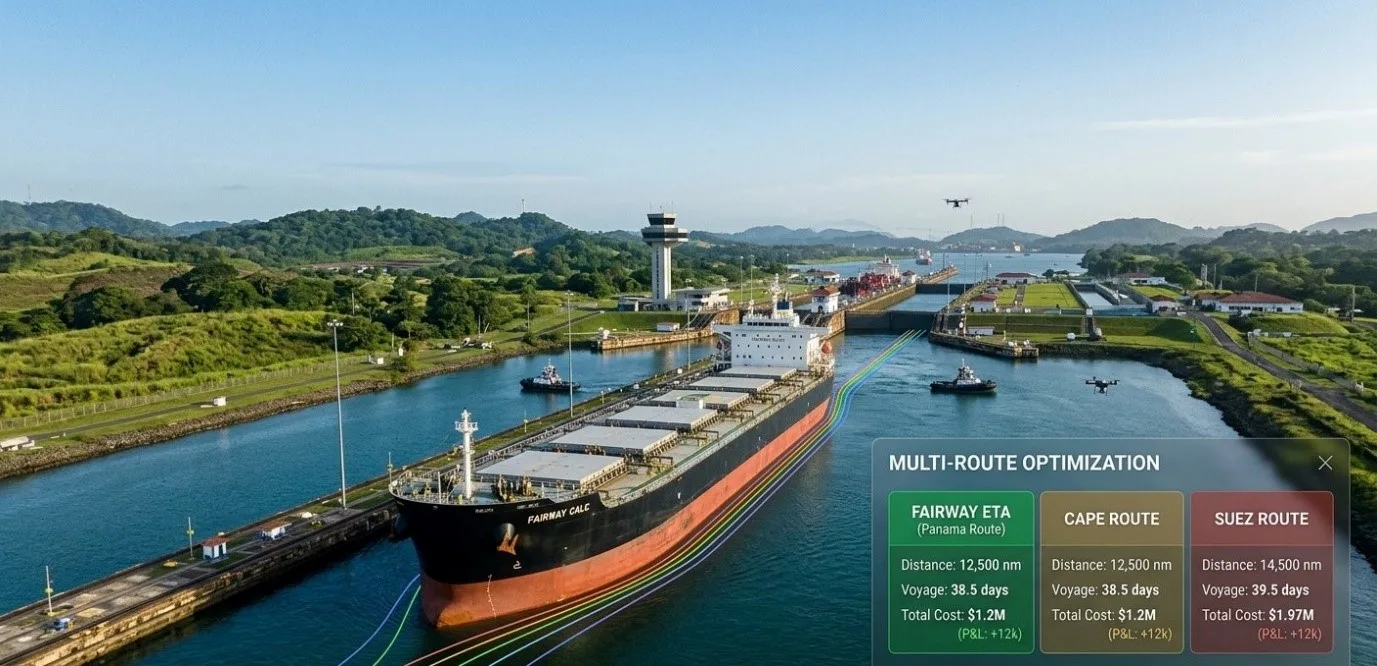
A modern ETA calculator should present multiple route options with full economic comparison: distance, voyage time, fuel consumption, ECA exposure, canal fees, and total cost. It should use pilot station coordinates — not port center points — for all supported ports, and encode canal scheduling windows rather than treating canals as free shortcuts.
The routing engine should reflect real vessel track patterns and infrastructure waypoints, producing results that match how ships actually sail rather than idealized geometric paths. Fairway ETA's calculator does this for 420+ ports across all vessel types — but regardless of which tool you use, the checklist below applies.
Voyage Planning Checklist
Before finalizing any voyage estimate:
- Verify pilot station coordinates for both ports
- Check canal transit windows against ETD
- Compare at least two viable routes
- Apply realistic speed (not nameplate)
- Calculate ECA distance separately for fuel cost
- Add 5–10% buffer for weather impact
- Verify against vessel-specific consumption curves
Final Thoughts
Accurate ETA calculation is no longer a back-of-envelope exercise. With canal disruptions, ECA enforcement, and volatile bunker prices, voyage economics are sensitive enough that a wrong route choice or a missed tide window can erase a charter's profitability. Six variables, not two. The difference is where the money goes.