The Complete Maritime
Voyage Intelligence Platform
ETA calculation, fuel optimization, market data, and industry insights — built for shipping professionals by shipping professionals.
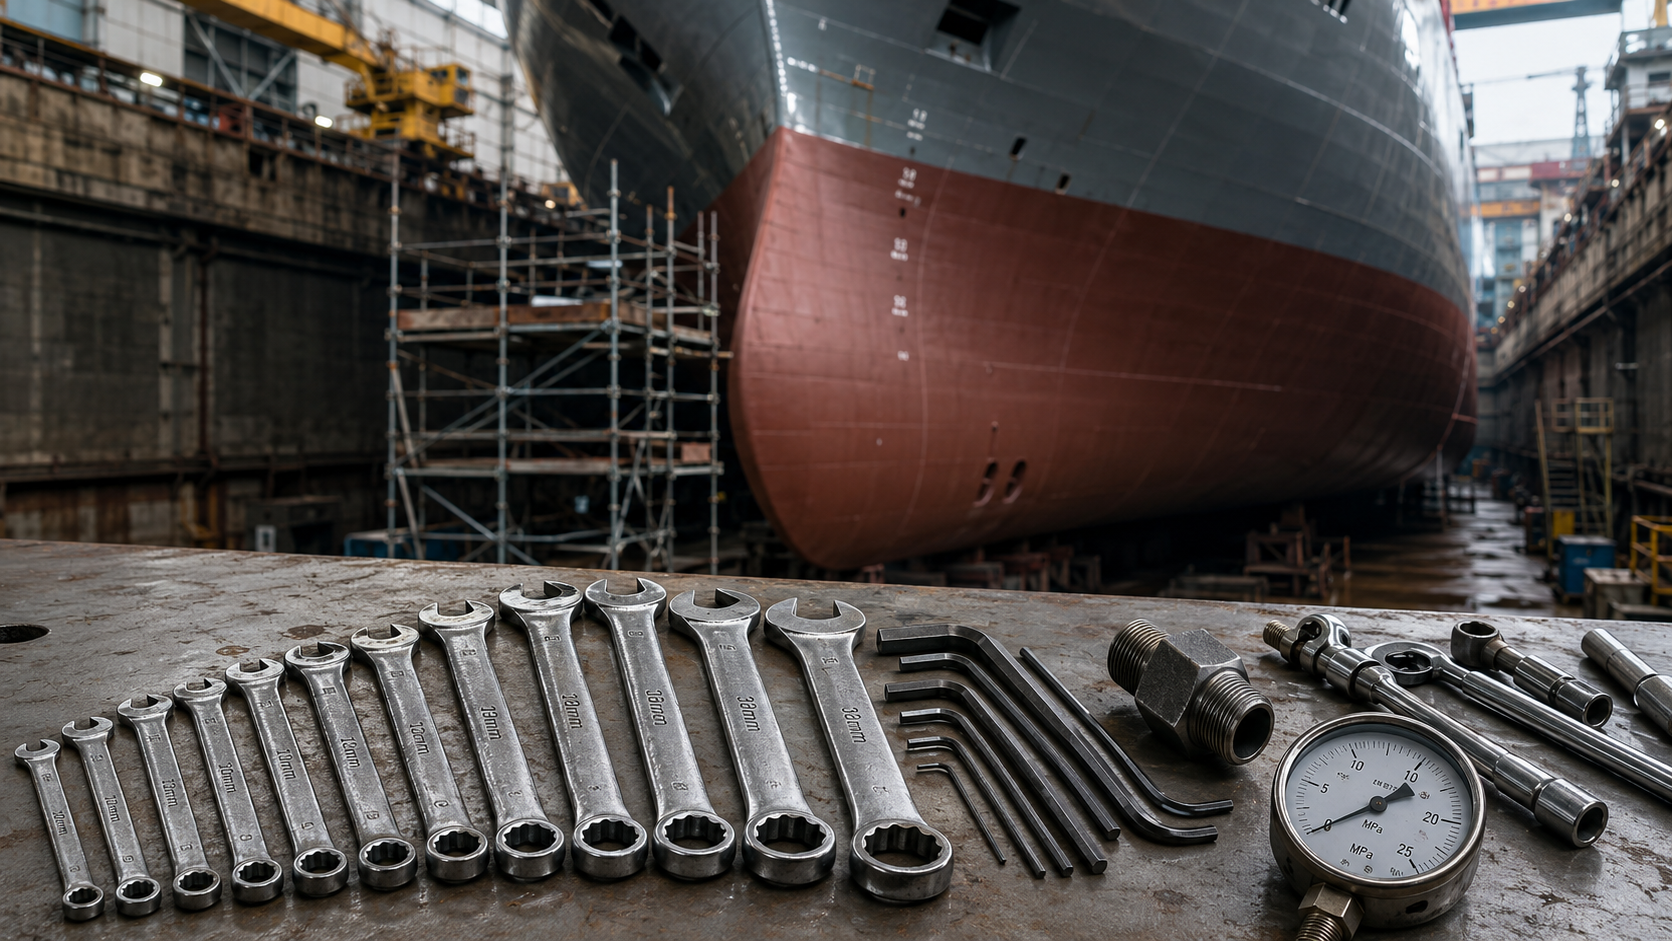
The Ship That's Half-Standardized — Where Global Shipbuilding Unified, and Where It Didn't
A modern ship's hull is standardized worldwide — same steel grades, same welding rules, same safety systems. But the tools and fittings inside the engine room still carry the fingerprints of whichever national industries supplied its engines and components. Why is one layer fully unified and the other one not?
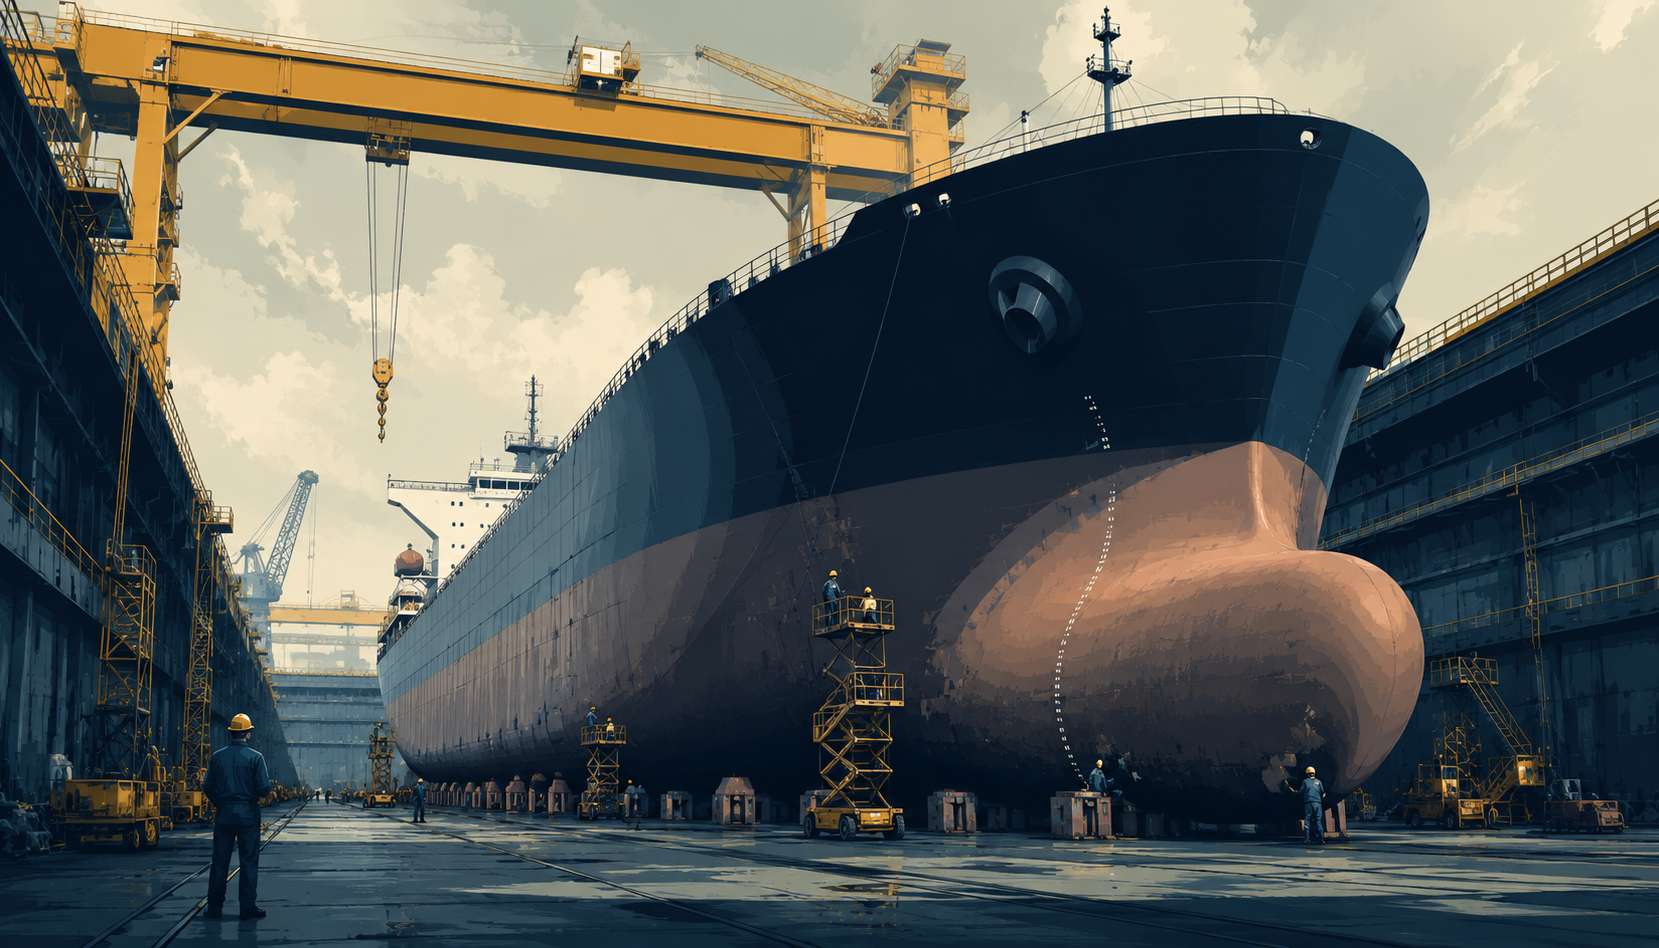
The Geography of Ship Repair — Where 12,000 Ships Head Every Year
Every large commercial ship returns to a repair yard on a 5-year regulatory cycle. In 2026 more than 12,000 vessels are due — and half of all dry-dockings happen in just three countries.
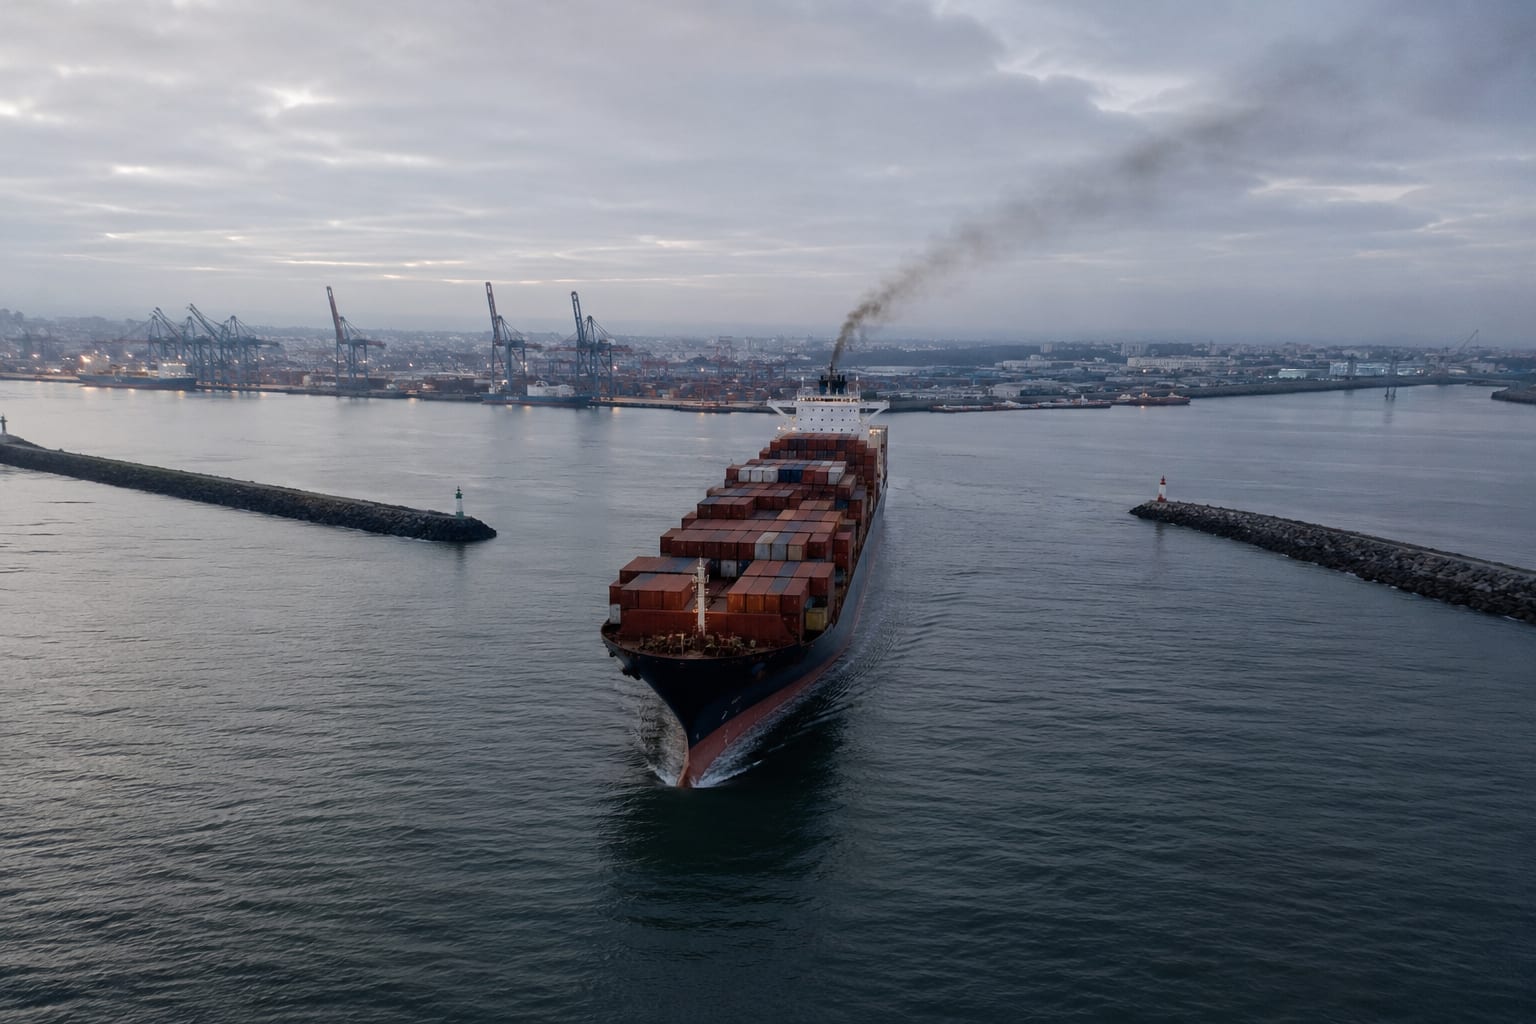
FuelEU Maritime — The Regulation That Measures What You Burn, Not How Much
The EU's FuelEU Maritime regulation completed its first compliance cycle in June 2026. Every ship above 5,000 GT calling at an EU port now carries a GHG intensity score — not on how much fuel it burned, but on how carbon-intensive that fuel was across its full lifecycle. The first year's 2% target was soft enough that most of the global fleet could meet it without changing fuel. The 2030 target of 6% will not be.
Latest Maritime Intelligence
Original analysis, explainers, and market commentary from the Fairtech editorial desk — covering the regulations, routes, and market shifts that move shipping economics.
The Ship That's Half-Standardized — Where Global Shipbuilding Unified, and Where It Didn't
A modern ship's hull is standardized worldwide — same steel grades, same welding rules, same safety systems. But the tools and fittings inside the engine room still carry the fingerprints of whichever national industries supplied its engines and components. Why is one layer fully unified and the other one not?
The Geography of Ship Repair — Where 12,000 Ships Head Every Year
Every large commercial ship returns to a repair yard on a 5-year regulatory cycle. In 2026 more than 12,000 vessels are due — and half of all dry-dockings happen in just three countries.
FuelEU Maritime — The Regulation That Measures What You Burn, Not How Much
The EU's FuelEU Maritime regulation completed its first compliance cycle in June 2026. Every ship above 5,000 GT calling at an EU port now carries a GHG intensity score — not on how much fuel it burned, but on how carbon-intensive that fuel was across its full lifecycle. The first year's 2% target was soft enough that most of the global fleet could meet it without changing fuel. The 2030 target of 6% will not be.
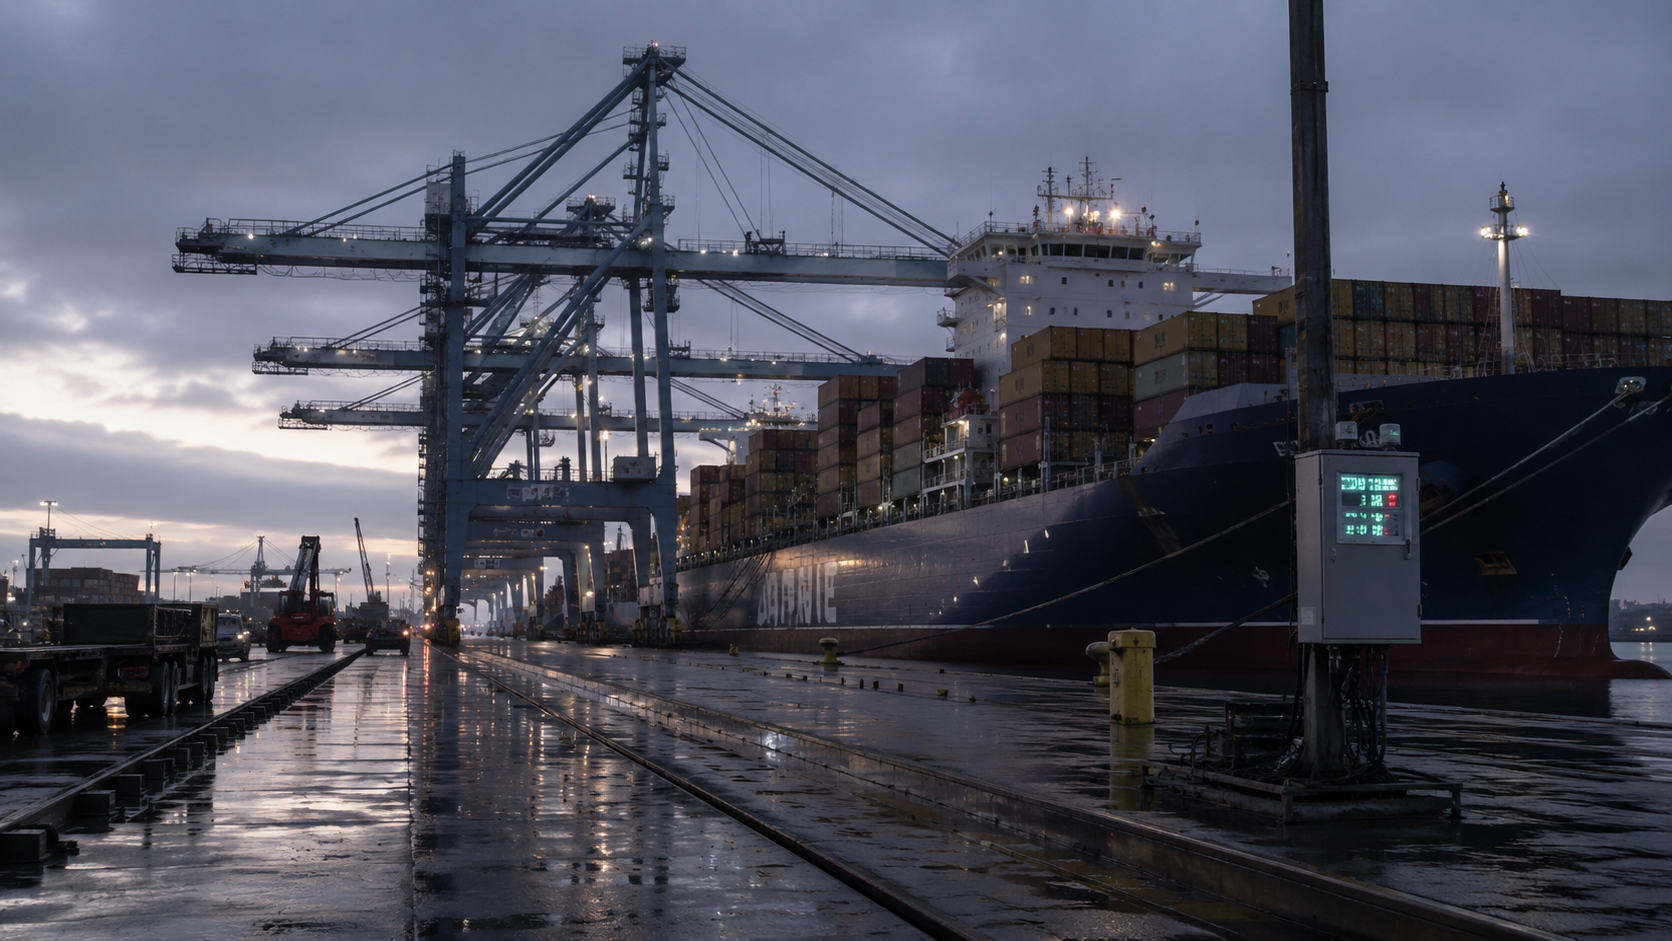
The Bill Arrived. The Market Didn't Flinch.
The UK Emissions Trading Scheme extended to maritime on July 1, 2026. Ships of 5,000 GT and above calling at UK ports now generate a carbon liability on every tonne of fuel burned alongside. The market response in the first week was close to zero. That silence is the story. The scheme was designed to land softly — a two-year surrender deferral, scope limited to domestic voyages and port emissions, and a UKA price roughly 25% below the EU equivalent.

The Carbon That Crosses an Ocean — Why Europe's Biggest Power Plants Burn Wood From Another Continent
Across Europe, dozens of converted coal power stations now burn wood pellets — none of which they grow at home. The Panamax bulk carriers delivering it from North America run roughly 4,500 nautical miles each voyage on conventional fuel oil. Under climate accounting rules, the fuel itself is counted as zero-carbon. The ships are not. From July 1, 2026, the United Kingdom's emissions trading scheme begins to charge those carriers for in-port emissions. The freight market is where two different carbon accounting systems first meet.
The Log the Surveyor Reads First — Ship Planned Maintenance, What It Costs, and What AI Is Changing
Ship planned maintenance explained: every main engine, generator, boiler, steering gear, and critical auxiliary system on a commercial vessel is tracked by a Planned Maintenance System — triggered by running hours or calendar intervals, documented for class survey, and mandated by the ISM Code. Maintenance accounts for 40% of vessel OPEX. AI predictive maintenance, now deployed on several hundred ships, promises to cut that cost by 30%. The technology is real. The adoption barrier is scale.
Everything You Need for Voyage Planning
Professional-grade tools for commercial shipping operations
Smart Route Engine
Compare Suez, Panama, Cape & Arctic corridors. Automatic optimal path with commercial or shortest-distance priority.
Precise ETA Calculation
Canal transit, port approach, seasonal weather from 14 ocean regions, and speed adjustments for real-world accuracy.
Fuel Cost Optimizer
VLSFO, MGO, HSFO with automatic SECA zone fuel switching. Full cost breakdown by route, fuel type, and EU ETS carbon cost.
Maritime Data Hub
Live bunker prices across 45 ports, BDI trends, crude oil tracking, currency rates, and freight indices — all in one dashboard.
ECA/SECA Compliance
Automatic emission control area detection with compliant fuel policies. 8 active ECA zones plus 2 upcoming (Norwegian Sea & Canadian Arctic, effective 2026).
Risk Zone Alerts
Real-time war risk and piracy zone detection. 8 monitored regions including Strait of Hormuz, Red Sea, and Gulf of Aden.
3D Globe & 2D Map
Interactive 3D globe with route visualization. 2D flat map with SECA, ECA, and risk zone overlays.
Professional Reports
Export voyage reports as PDF and Excel. Route comparison, fuel costs, ROB projection, and CII rating estimation.
Maritime Data Hub
Your Daily Market Intelligence
Real-time market data trusted by operations teams worldwide
Bunker Prices
45 ports, 9 regions, VLSFO/MGO/HSFO with trend charts
Freight Indices
BDI, BDTI, BCTI, SCFI with daily earnings and route references
Crude Oil & Energy
Brent, WTI, Dubai benchmarks with EU ETS carbon pricing
Voyage Cost Reference
Canal fees, risk zones, ECA regulations, weather guides
Get Your ETA in 3 Steps
No signup required — start immediately
Configure Vessel
Select ship type from 8 categories, set speed and fuel preferences from 50+ engine presets.
Calculate Routes
Our algorithm evaluates all corridor options with weather, ECA zones, and canal availability. Compare costs instantly.
Export & Decide
Download professional PDF/Excel reports. Share with charterers, review ROB projections, and verify CII compliance.
Built on Real Maritime Expertise
Comprehensive global coverage with pilot station data
Verified coordinates for accurate port approach timing
Market data refreshed daily with industry-standard sources
Industry Partner Program
We are preparing a curated directory of maritime service providers — bunker suppliers, ship agents, classification societies, P&I clubs, and more.
Partner listings launching late 2026. For early inquiries, contact hello@fairwayeta.com.