When Houthi rebels attacked commercial vessels in the Red Sea in November 2023, the world's largest shipping lines began rerouting around the Cape of Good Hope. Most assumed it would be temporary. Two and a half years later, it's still the default.
The 2026 Hormuz crisis has made things worse. Not only is the Red Sea still dangerous, but the Strait of Hormuz — the other critical Middle Eastern chokepoint — is now effectively blocked. Any remaining hope of Suez services normalizing has been pushed out by at least six months.
For voyage planners, the question is no longer "Suez or Cape?" It's "How do I make the Cape route profitable?"
The Numbers: Suez vs Cape Side by Side
The cost difference between Suez and Cape is more nuanced than most operators realize. A longer route doesn't always mean a more expensive voyage — and a shorter route doesn't always mean a cheaper one.
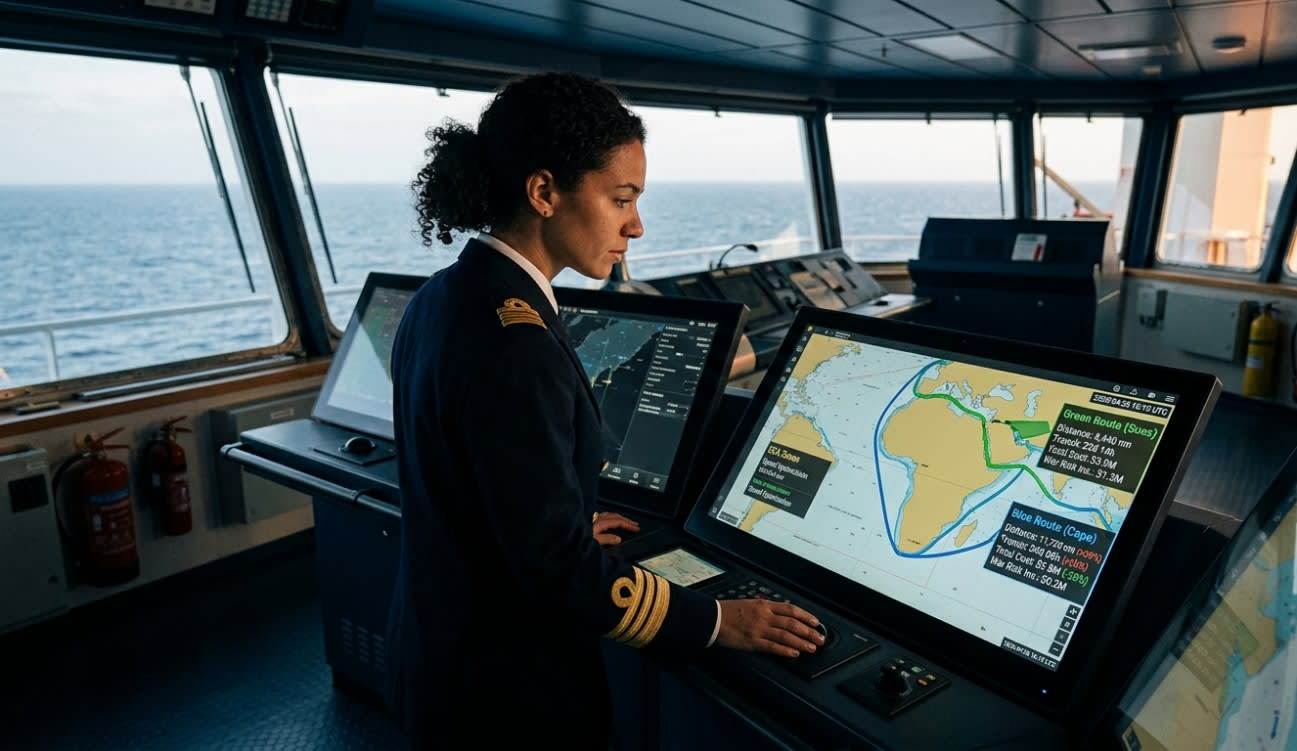
| Metric | Suez Canal | Cape of Good Hope |
|---|---|---|
| Distance (Shanghai–Rotterdam) | ~8,440 nm | ~11,720 nm (+39%) |
| Transit time (at 15 kn) | 22–24 days | 34–38 days (+55%) |
| Fuel consumption | ~2,800 t VLSFO | ~3,640 t (+30%) |
| Fuel cost (at $700/MT) | ~$1.96M | ~$2.55M |
| Canal toll | $300K–700K | $0 |
| War risk insurance | $1.0M–1.5M | $200K–300K |
| Total voyage cost | ~$3.3M–4.2M | ~$2.8M–2.9M |
When the math changed: in normal times, Suez wins easily — 10 fewer days at sea means higher fleet utilization, faster delivery, and better market responsiveness. But since late 2023, war-risk insurance premiums for Red Sea transit have been so high that the Cape route has actually become the cheaper option for most vessels.
Canal tolls alone can reach $300,000 to $700,000 depending on vessel size. A fully laden 20,000 TEU container ship may pay close to $700,000 just for Suez transit. Add $1–1.5 million in war-risk insurance during crisis periods, and the Suez route becomes significantly more expensive than the longer Cape voyage.
The Hidden Costs of Cape Routing
While Cape routing saves on canal tolls and war-risk insurance, it introduces costs that don't appear on a standard voyage estimate:
Fleet capacity loss. Each vessel spends 12–14 extra days per round trip on the Cape route. Across a fleet, this effectively removes 8–10% of shipping capacity. For the global container market, this capacity reduction has been a major driver of rate increases since 2024.
Crew and maintenance. Longer voyages mean more wear on engines, higher crew costs, and compressed maintenance windows between voyages.
Weather exposure. The Cape route crosses some of the world's roughest waters. Southern Ocean swells and Agulhas Current crossings add weather risk that the sheltered Suez route largely avoids. A westbound crossing in winter can reduce effective speed by 10–15%.
Schedule reliability. Longer routes mean more exposure to variables. A 38-day voyage has more opportunities for delays than a 24-day voyage.
Opportunity cost. A vessel that makes 5 round trips per year via Suez might only make 3.5 via Cape. That lost voyage represents millions in foregone revenue.
The Slow Steaming Factor
One of the most significant — and underappreciated — elements of the Cape vs Suez calculation is speed optimization.
At current fuel prices, slowing down from 16 to 13 knots on the Cape route can cut fuel consumption by nearly 40%. The cube law of ship resistance means that small speed reductions yield disproportionate fuel savings.
For some operators, the math works out surprisingly well: accept the longer transit time, slow-steam the Cape route, save on fuel, save on canal tolls, save on insurance — and still come out ahead of a Suez transit at full speed with war-risk premiums.
This is exactly the kind of multi-variable optimization that modern voyage planning tools need to handle. A calculator that only shows distance and time misses the real story.
Who Benefits from Cape Routing?
Not everyone loses from the shift to Cape routing. The redistribution of traffic has created clear winners and losers.
- Shipping lines — reduced capacity drives up freight rates
- South African ports — increased bunkering demand
- Slow-steaming operators — fuel-efficient fleets gain edge
- Cape bunkering hubs — new refueling stop demand
- Suez Canal Authority — revenue collapse
- Egyptian economy — Suez is major GDP contributor
- JIT shippers — 12–14 extra days breaks lean supply chains
- Fuel-intensive vessels — older ships burn disproportionately more
What This Means for Your Voyage Planning
The Suez-vs-Cape decision in 2026 is not a simple binary. It's a multi-variable optimization problem that changes with every shift in fuel prices, insurance rates, and geopolitical conditions.
Modern voyage planning should answer these questions for every voyage:
- At current bunker prices, what's the total fuel cost difference between Suez and Cape?
- With today's war-risk premiums, does Suez transit make economic sense?
- What's the optimal speed on each route to minimize total voyage cost?
- How does ECA zone exposure change between routes?
- What's the schedule impact on downstream port calls and laycan windows?
If your planning tools can't answer these questions in real time, you're making million-dollar routing decisions based on incomplete information.