Last week, a number called the Baltic Dry Index jumped 19% in three trading days. By Wednesday it hit 3,189 — the highest level since November 2023. By Friday it had pulled back a bit, to around 3,151.
If you read shipping headlines, you saw the spike framed in several different ways. Some said it was about Hormuz. Some said it was about China. Some called it a recovery signal for the global economy. Most of those explanations captured part of the move, but not the mechanics underneath it.
Let's see what the BDI actually is, what it just did, and why the most common framings miss the point.
What the BDI Actually Measures
The Baltic Dry Index is a daily price assessment published by the Baltic Exchange in London. It is not a measure of shipping volume. It is not a measure of trade growth. It is, very specifically, an average of what shipowners are charging to hire out three sizes of dry bulk carrier, across a basket of benchmark routes.
The three sizes:
- Capesize — the biggest. Roughly 180,000 tonnes deadweight. Too large for the Suez or Panama canals, which is why they “go around the Cape” — and where the name comes from. These ships carry iron ore from Australia and Brazil, and coal across long distances.
- Panamax — mid-sized, around 80,000 tonnes deadweight. Fits the original locks of the Panama Canal (hence the name). Carries grain, coal, and assorted bulk cargo.
- Supramax — smaller, around 60,000 tonnes. More flexible — fits in more ports, carries more varied cargo.
Every weekday, a panel of brokers reports indicative time-charter rates across the benchmark routes. The Baltic averages and weights those rates: 40% Capesize, 30% Panamax, 30% Supramax. The headline BDI is the resulting composite.
The BDI has been published since November 1, 1999, replacing the earlier Baltic Freight Index (BFI). The current 40/30/30 weighting — Capesize, Panamax, Supramax — was established in March 2018 when the Handysize component was removed. A 0.1 multiplier is applied to the weighted average of sub-index time-charter rates to produce the headline number: a BDI of 3,189 corresponds to a weighted average of roughly $31,890/day across the three vessel classes.
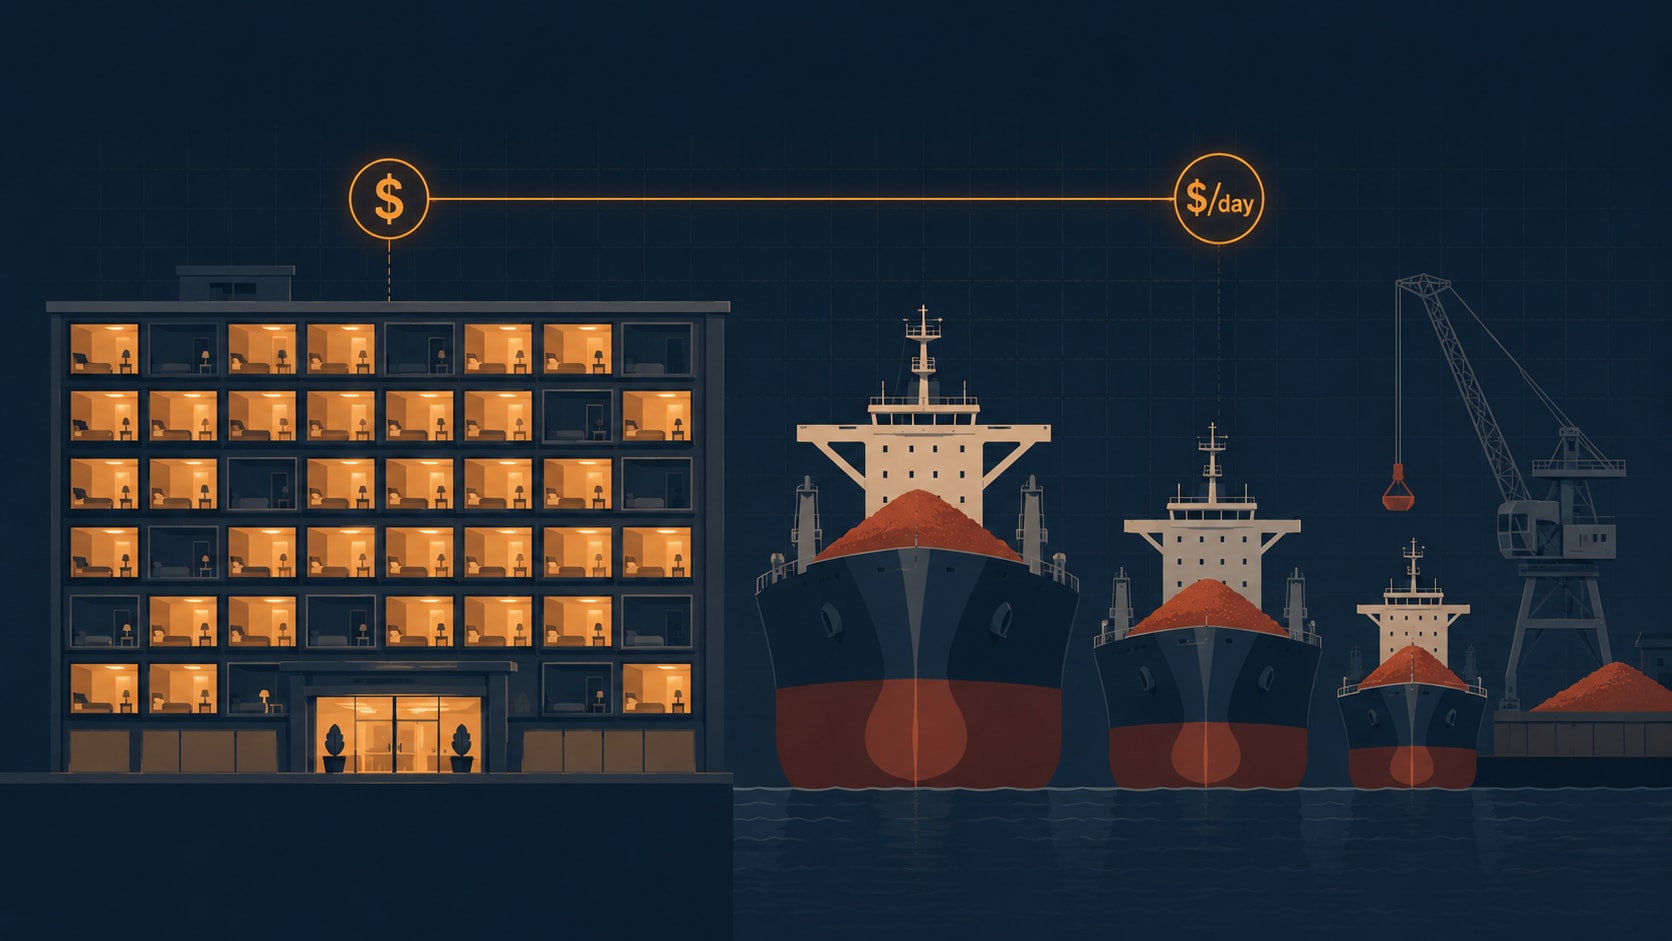
Think of it a bit like a hotel occupancy index — it doesn't tell you what one specific room costs at one specific hotel, and it doesn't tell you how many people are checking in. It tells you what the market price is for getting a room across a basket of properties, on a typical day, in a typical location. When the index moves, it's telling you something about supply and demand in that basket — not directly about anything else.
Why the BDI Just Jumped
So why did the index jump 19% in three days last week?
The intuitive read — and the most common headline framing — was that the spike reflected new demand. More shipping = more cargo = global economy recovering. That story is appealing but doesn't survive a fundamentals check.
The real driver was something more specific: iron ore tonne-miles.
A tonne-mile is exactly what it sounds like — one tonne of cargo moved one nautical mile. It is the unit that actually drives Capesize freight rates, because what shipowners care about is not how many tonnes shipped in total but how long each shipment takes. A ship that spends 35 days on a voyage from Brazil to China earns more than the same ship spending 22 days from Australia to China — even if the cargo size is identical.
Three things lined up in early May:
- Iron ore prices hit their highest level since October 2024, on stronger Chinese steel mill demand. Higher iron ore prices encourage mills to lock in more cargo, which means more vessels chartered.
- Chinese portside iron ore inventory had been building for months, reaching a record 179.5 million tonnes in mid-March. Mills were drawing some of that down, but imports kept coming.
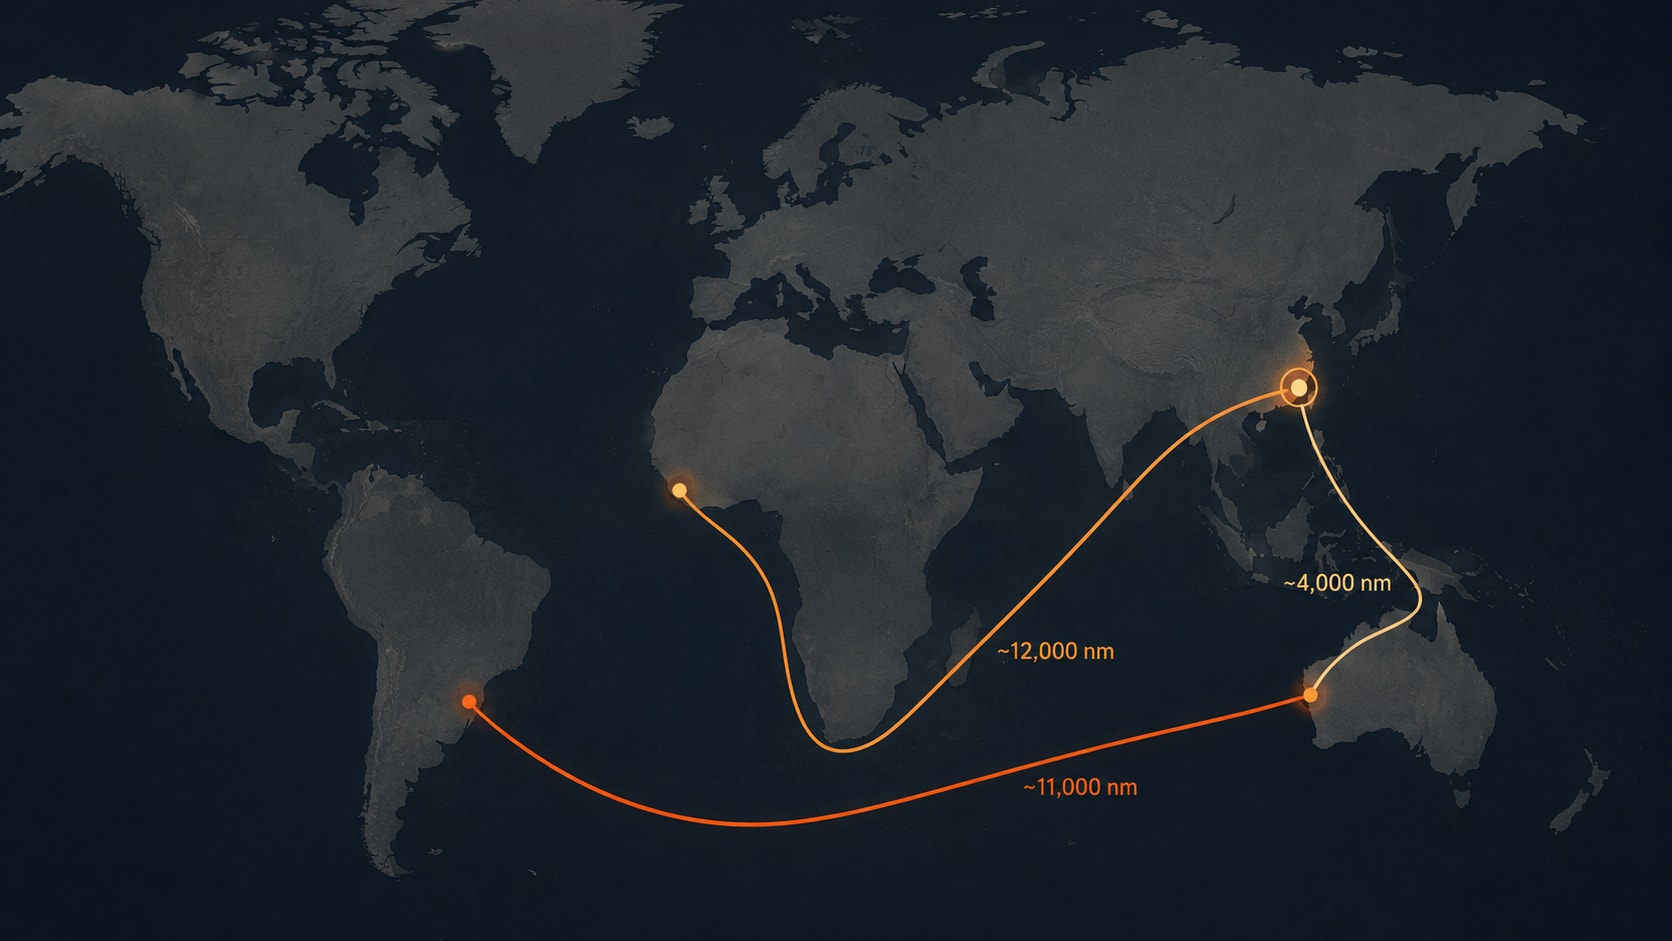
- Guinea began shipping iron ore commercially from the long-developed Simandou project. Guinea-to-China is roughly 12,000 nautical miles via the Cape of Good Hope. Compare that to Australia-to-China at around 4,000 nautical miles. Every Simandou cargo takes roughly three times the ship-days of an equivalent Australian one.
On their own, none of these factors would have moved the market this much. Together, they tightened the Capesize market very quickly.
And the third point is the one most headlines missed. The same volume of iron ore, just shipping further, generates more freight demand even though no new cargo “appeared.” The market wasn't getting bigger — it was stretching.
This is the part that matters most because it explains something headlines often flatten into a single word: “demand.” What actually moves a dry bulk index can have nothing to do with the world economy at all. Just the routes change.
Why Headlines Get the BDI Wrong
When a major index moves 19%, news outlets need a story to attach to it. The fastest story to write is the simple one — “demand is back,” or “global trade strengthening.” Often that story is roughly true. Often it isn't.
Here are three things to check whenever you see a BDI headline:
Is the move driven by Capesize, Panamax, or Supramax? Capesize moves are almost always about iron ore and coal — the bulkiest, longest-distance trades. Panamax moves are often about grain and coal at medium distances. Supramax tends to reflect smaller commodities and shorter routes. The composite hides which one moved.
In last week's jump, Capesize was the engine. It rose 22% while Supramax barely moved (+3%). That alone tells you the spike was about long-distance bulk — almost certainly iron ore — and not about diversified global demand.
Is more cargo moving, or is the same cargo moving further? This is the tonne-miles question. A BDI rally on stable cargo volumes but lengthening routes is a different signal than a BDI rally on growing cargo. The first reflects geographic shifts in mining or sourcing; the second reflects actual economic expansion.
Is the spike sustained, or is it a positioning move? Dry bulk markets are thin enough that a few large charterers locking in tonnage at once can move the index meaningfully for a day or two. A real shift in demand looks different — it persists across multiple weeks and shows up in forward freight derivative (FFA) prices.
If you keep these three questions in mind, you'll find most BDI headlines tell you less than they appear to.
How to Watch It Yourself
Following the BDI in a useful way doesn't require a Baltic Exchange subscription. Most major financial news terminals carry it, and so does our own Maritime Data Hub — where you can track the BDI alongside its three sub-indices, updated regularly.
A few reading habits worth picking up:
- Watch the sub-indices, not just the composite. Capesize and Panamax often move in different directions for different reasons. The headline number averages them out and hides the story.
- Compare the BDI to the FFA forward curve. Forward freight agreements price what the market expects the BDI to be in three or six months. When spot prices rise faster than the forward curve, the market is treating the rally as temporary.
- Cross-check with cargo data. If the BDI is moving but actual iron ore or coal shipment volumes aren't, the move is probably about routing, scheduling, or speculation — not about demand.
None of these tools gives a perfect read on the market by itself. Together, though, they help separate short-term noise from structural shifts.
What the BDI Doesn't Tell You
A few common mistakes worth flagging, because they show up in financial commentary often:
The BDI is not a measure of containerized trade. Containers are tracked by completely separate indices — SCFI, FBX, CCFI. When you see news about consumer goods, electronics, or finished products, the BDI is usually not the relevant indicator. Use the container indices instead.
The BDI is not a measure of tanker shipping. Crude oil and refined products move on different vessels with different rate structures. The relevant indices for that side of the market are the BDTI (Dirty Tanker) and BCTI (Clean Tanker), which have followed a very different trajectory through 2026 than dry bulk has.
The BDI is not a perfect leading indicator of the global economy, even though it sometimes gets described that way. It is a leading indicator of dry bulk freight demand, which correlates with industrial activity in commodity-importing economies — but the correlation isn't tight, and there are years where the BDI moves on its own internal supply-and-demand cycle without much to say about the world economy.
What the BDI is good for: tracking the cost of moving raw materials by sea, in something close to real time, in a way that's relatively resistant to manipulation compared with many financial indicators.
The 30-Second Version
- The BDI is a daily average of dry bulk freight rates across Capesize, Panamax, and Supramax ships.
- Last week it jumped from 2,675 to 3,189 — its highest level since November 2023.
- Most of the move came from Capesize, which means iron ore — and most of that was about longer voyages from Brazil and Guinea, not new demand.
- Don't read the BDI as a single signal about “global trade.” Look at the sub-indices, the tonne-miles, and the forward curve.
- And remember what it isn't measuring: containers, tankers, or the broader economy. Just dry bulk freight, daily, across a fixed basket of routes.
Closing
The Baltic Dry Index has been published in some form for decades, and it remains one of the few market indicators that genuinely reflects physical shipping fixtures rather than financial speculation.
But “reflects physical fixtures” doesn't mean “easy to interpret.” The next time you see a BDI headline, the most useful thing you can do is ask one extra question before believing the framing.
Did the cargo grow, or did the route stretch?
In dry bulk shipping, the difference matters more than the headline usually suggests.