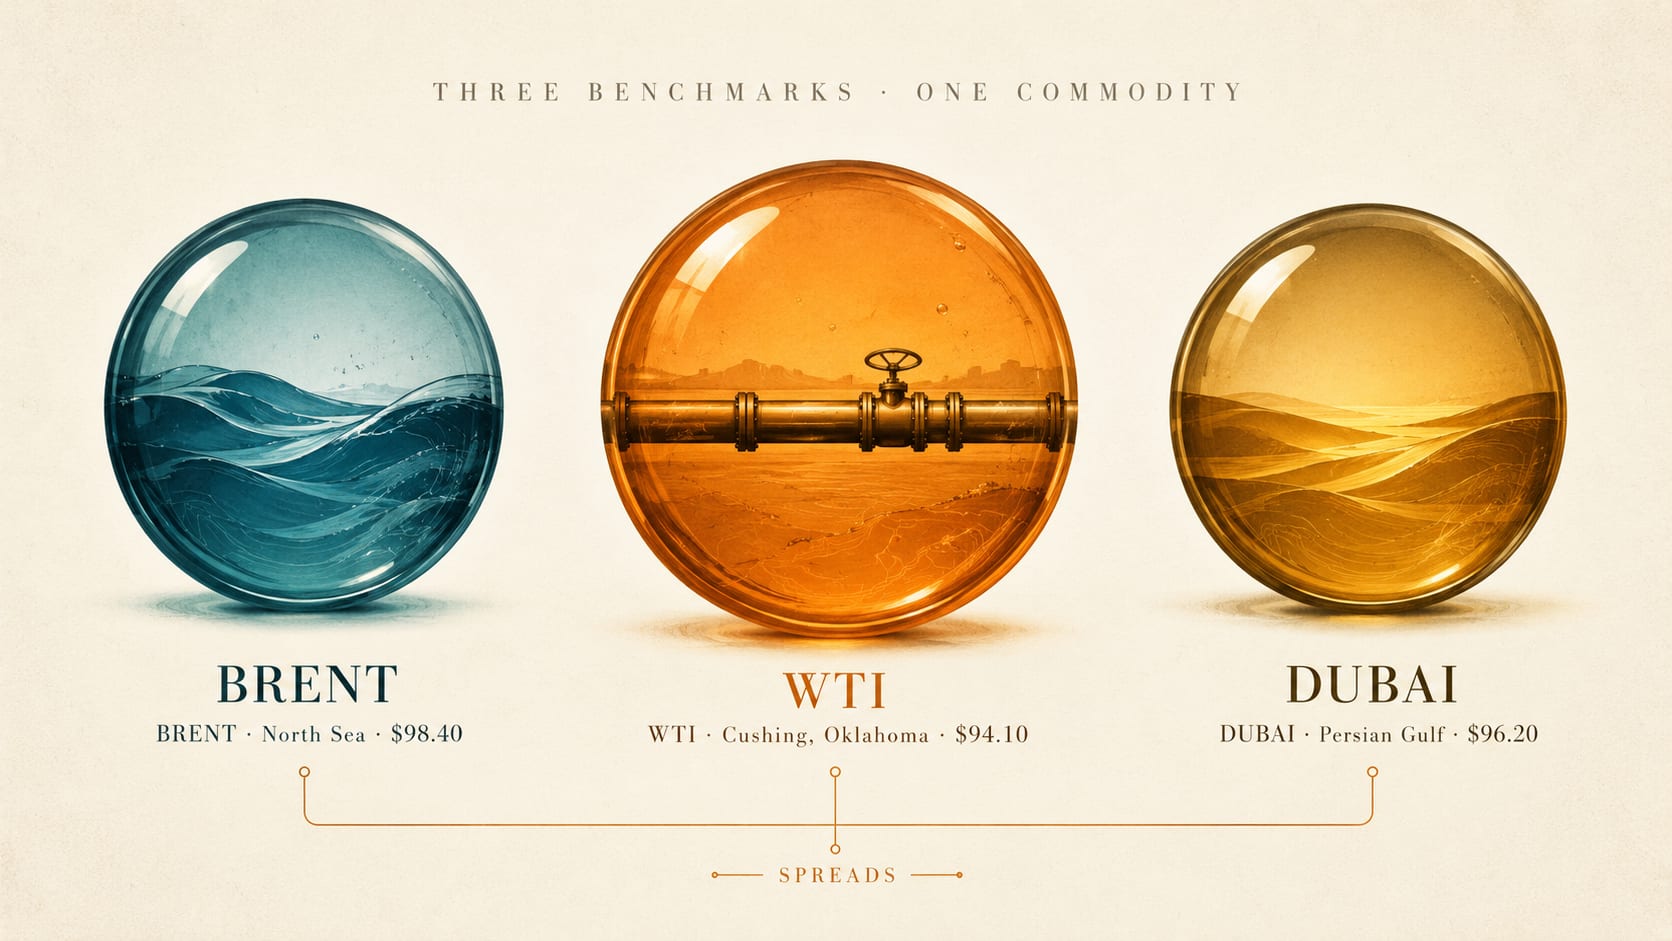
Open any energy news feed and you'll see something strange. There isn't one oil price. There are three, usually within a few dollars of each other, quoted in this order: Brent, WTI, Dubai.
Most days, they move roughly together. Then every so often, one breaks away from the others — and that's usually the interesting part. This isn't a quirk of journalism. It reflects how the global oil market actually works. Crude oil isn't one commodity. It's many — with different chemistries, produced in different regions, sold under different contracts. Three benchmark prices have emerged because the global market sorts itself into three rough zones, and the spread between them tells you something the headline price alone never does.
Let's see what each one actually measures, and what the gaps between them are saying.
Brent: The North Sea Anchor
Brent is the benchmark for roughly two-thirds of internationally traded crude — or closer to three-quarters by some industry estimates, depending on what you count as “priced against” it. It is named after the original Brent oilfield in the North Sea, between Scotland and Norway, which is now nearly depleted. Today the “Brent” price refers to a basket of five North Sea crudes — Brent, Forties, Oseberg, Ekofisk, and Troll (BFOET) — that share similar chemistry and trade on the ICE futures exchange in London.
We covered the Brent name and its history in an earlier piece. The short version: the brand outlived the oil.
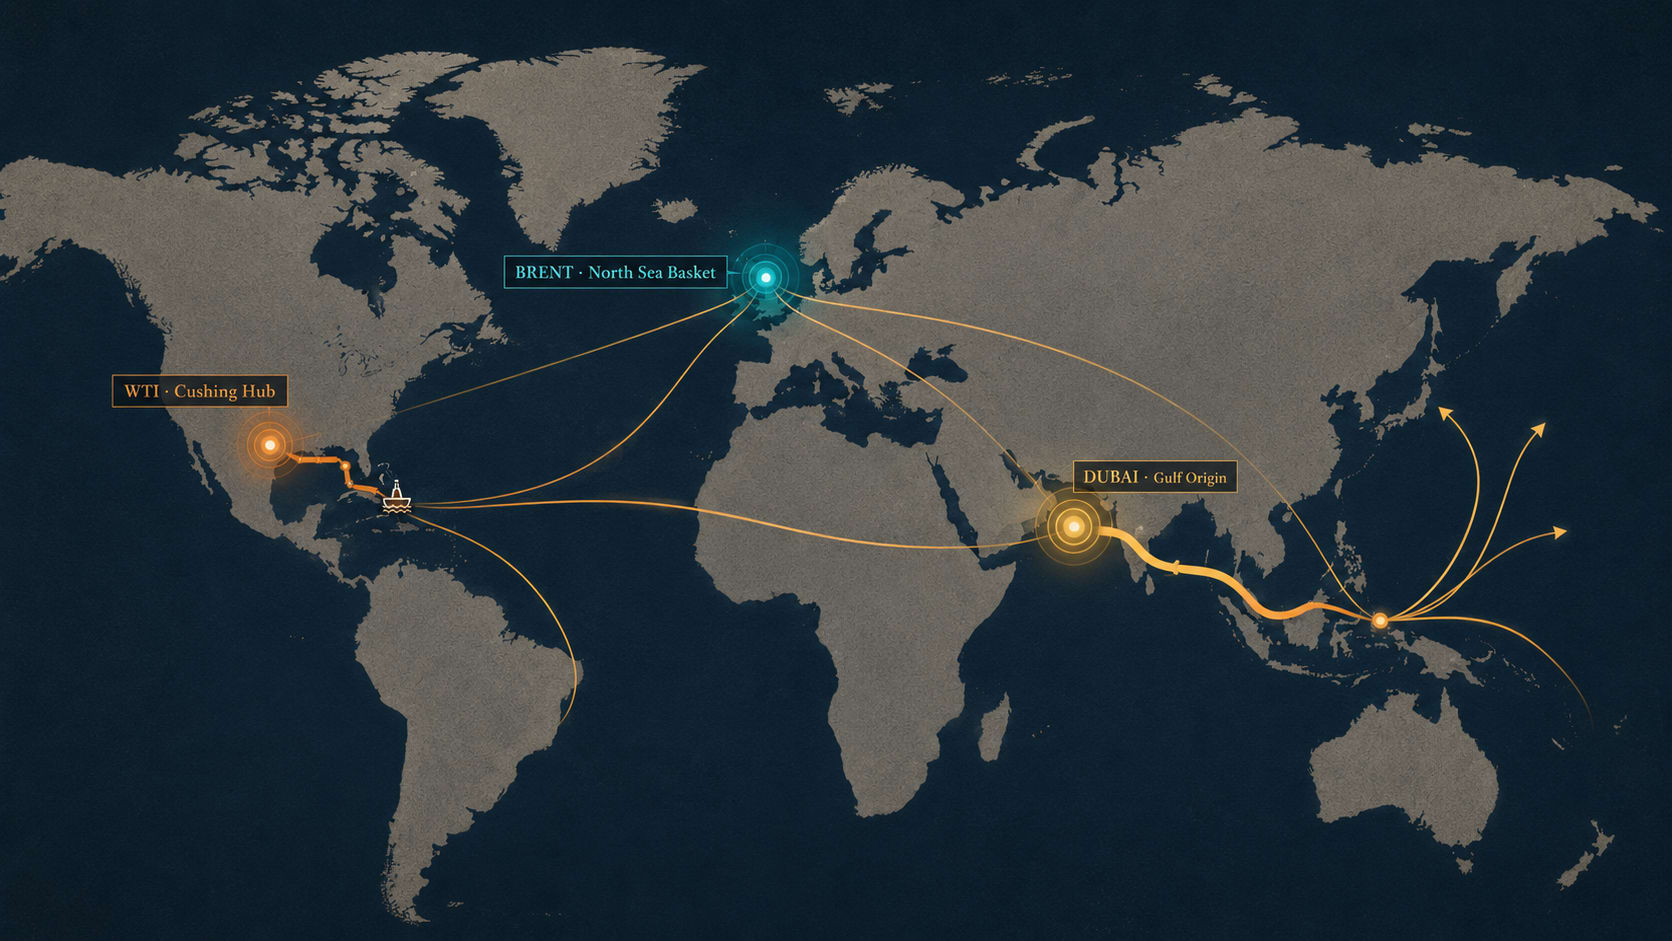
The defining feature of Brent is that the crude it represents is loaded onto ships at North Sea terminals and exported globally. It is a seaborne benchmark. When refiners in India, Singapore, or Brazil quote crude prices, they are usually quoting some version of Brent.
In crude terms, Brent is light (low density, easy to refine) and sweet (low sulfur content, less expensive to process). That makes it desirable, and partly explains why it sits at the top of the global pricing hierarchy.
WTI: The American Landlocked Benchmark
WTI stands for West Texas Intermediate. It is the benchmark for crude produced in the United States, and the price is set by futures contracts on the New York Mercantile Exchange (NYMEX).
Here is the thing most people don't realize: WTI futures are physically settled at a single inland location — Cushing, Oklahoma. Cushing is a pipeline hub, not a port. The crude that backs WTI prices doesn't reach a ship without first traveling through a pipeline.
Think of WTI a bit like an inland train terminal. The oil isn't trapped there permanently, but everything has to pass through the junction first. When the junction gets congested — when pipeline capacity is tight, or when storage at Cushing fills up — WTI can move sharply against Brent even though nothing has changed in the underlying oil market.
The most extreme example happened in April 2020, when storage at Cushing nearly filled during the COVID demand collapse. WTI briefly traded at negative prices — sellers were paying buyers to take the oil off their hands. Brent that day was around $20 per barrel. Same kind of oil, two different markets, moving separately.
On quality alone, WTI would often be expected to trade above Brent. It is slightly lighter and sweeter. The fact that it usually trades at a discount reflects the cost of moving that crude from inland production to international buyers.
Dubai: The Asian Gateway
The third major benchmark is Dubai, sometimes quoted as “Dubai/Oman” or DME Oman. It represents crude produced in the Persian Gulf and exported through the Strait of Hormuz to Asian refiners.
Dubai is the youngest of the three benchmarks and the most important one for understanding flows into Asia. Most of the crude exported from the Persian Gulf ends up in Asia, and most of that prices off Dubai. When you read about Saudi Aramco's monthly Official Selling Prices, or about Iranian oil flowing into China, the underlying reference is usually Dubai-Oman.
Chemically, Dubai sits at the heavier end. It is denser than Brent and contains more sulfur — what the industry calls medium-sour. That makes it less valuable per barrel, which is why it usually trades at a small discount to Brent. But it is also the kind of crude that most Asian refineries are built to handle. Singapore, Japan, South Korea, and China have refineries optimized for medium-sour grades, not the lighter sweet crudes of the North Sea or Texas.
Dubai is also the benchmark most exposed to Middle East geopolitics. When tensions in the Strait of Hormuz rise, Dubai prices respond first and most. Brent and WTI usually follow, but the magnitude of the move tells you whether the market sees the disruption as regional or global.
Why the Spreads Matter
So three benchmarks, three regions, three chemistries. Why does any of this matter for someone reading a shipping or energy headline?
Because the spread — the difference between the three prices — is what actually drives the global flow of oil.
A simple example. If WTI trades at a deep discount to Brent — say $5 or more below — American crude becomes cheap relative to North Sea crude. Buyers in Europe and Asia start booking US Gulf Coast cargoes. Tankers shift to load at Houston, Corpus Christi, and Beaumont. We saw exactly this after 2018, when rising shale production and pipeline bottlenecks pushed more US crude toward export markets.
A second example. If Dubai trades at a premium to Brent — unusual, but it happens during Middle East supply shocks — Asian refiners look westward for alternatives. They start buying more West African or Atlantic Basin crude. The shipping pattern reverses: more long-haul cargoes from Angola, Nigeria, and Brazil heading to Singapore, Yeosu, and Ningbo.
In both cases, the price spread reorganizes the map of global oil shipping. Refiners don't care about the absolute price as much as they care about the relative one. The cheapest delivered barrel wins.
This is why traders and shipping desks watch the spreads, not just the headlines. The headline tells you what oil costs today. The spreads tell you where it's about to come from.
When They Diverge, Pay Attention
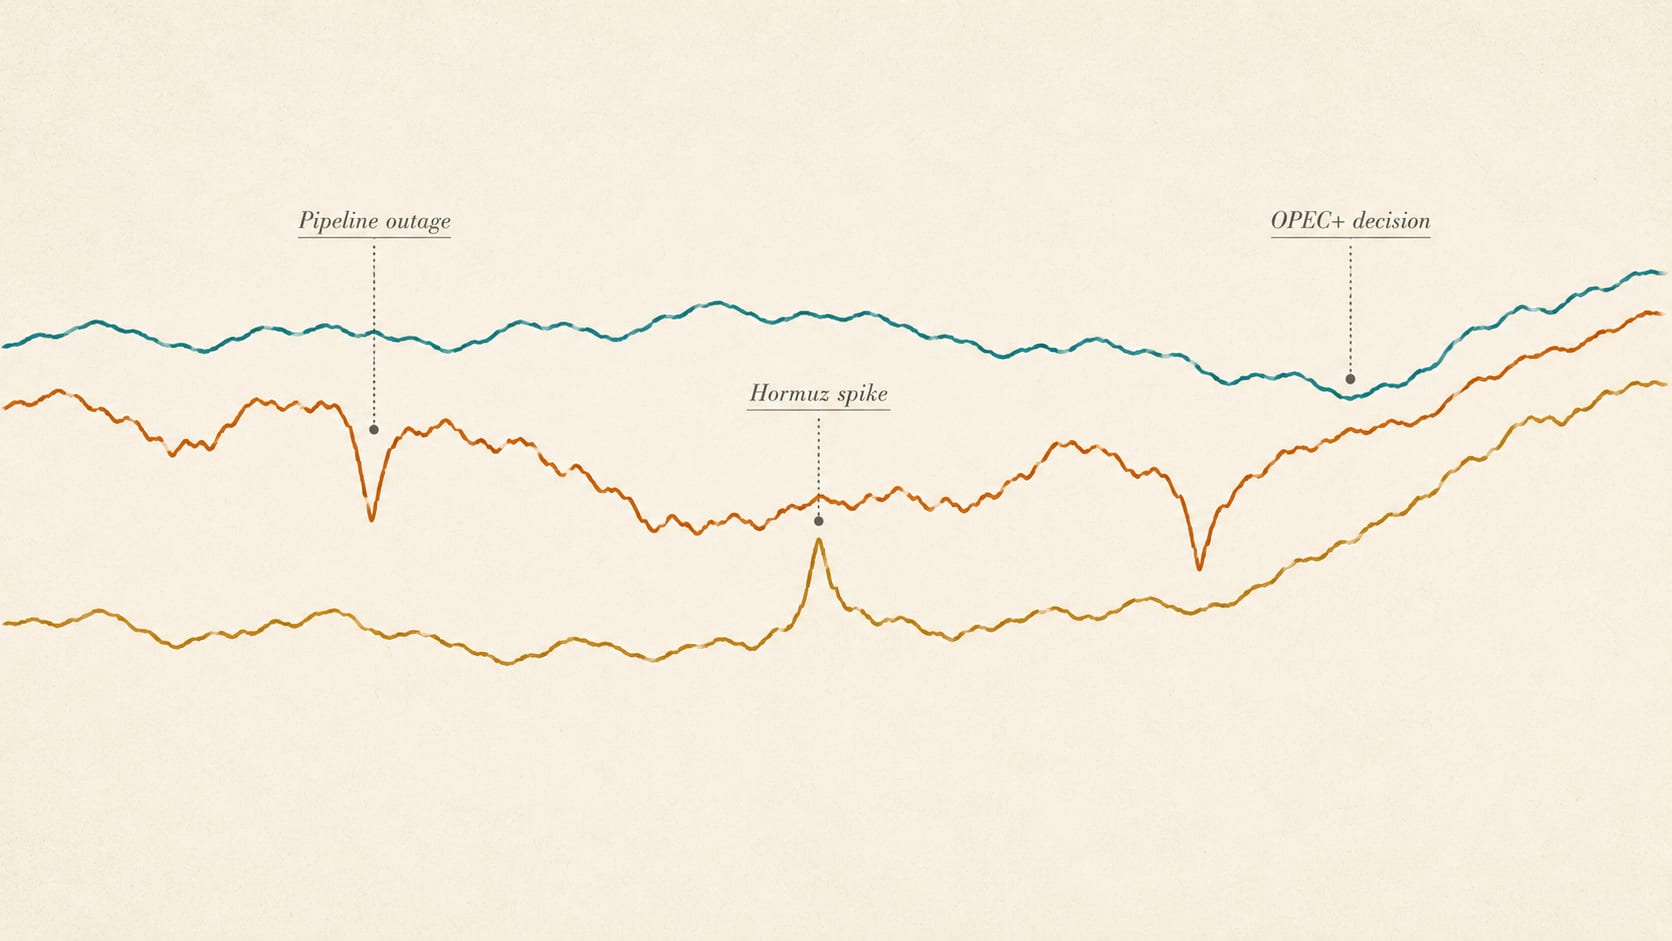
In a calm market, the three benchmarks move in lockstep. Brent rises, WTI rises with it, Dubai follows. The spreads stay roughly constant, reflecting transport costs and chemistry differences.
When they don't move together, something structural is happening. A few patterns worth recognizing:
When WTI drops sharply against Brent, that's usually a sign the problem is local to the US market rather than crude demand globally. Pipeline outage, Cushing storage build, or a sudden demand drop in the US — these show up in WTI first.
When Dubai jumps against Brent, the issue is regional. A geopolitical disruption near the Persian Gulf, a Saudi production cut, or a sudden surge in Asian buying — these show up in Dubai first.
When all three move together but at different magnitudes, the market is pricing a global story — usually OPEC+ policy, a major supply disruption, or a worldwide demand shock. The biggest mover tells you where the impact is concentrated.
Reading the relationships between the three is more useful than reading any one in isolation.
How to Watch the Three Together
One useful habit is to stop looking at oil prices as a single number. Watch which benchmark moves first. Watch which one moves furthest. And watch whether shipping activity follows the move or ignores it.
A sharp WTI discount with no increase in US Gulf Coast loadings usually fades quickly — the spread is reflecting a temporary inland bottleneck, not a real shift in global flows. A persistent Dubai premium, on the other hand, tends to mean something bigger is happening in Asian crude routing. The ships will eventually tell the same story.
You don't need a Bloomberg terminal to follow the three benchmarks. Most energy news sites quote all three daily, and our own Maritime Data Hub tracks them side by side, updated regularly. Comparing today's spread to the 30-day or 90-day average tells you whether you're looking at noise or signal.
The three benchmarks aren't redundant. They are three measurements of three different oil markets that happen to share a name in casual headlines. Reading them together gives you a more honest picture than any one of them alone.
The 30-Second Version
- Brent: North Sea benchmark. Light, sweet, seaborne. Anchors about two-thirds of global oil trade.
- WTI: American benchmark, settled inland at Cushing, Oklahoma. Lighter and sweeter than Brent, usually at a discount because of transport costs.
- Dubai: Asian-facing benchmark for Persian Gulf crude. Medium-sour, the reference for most Saudi, Iranian, and Iraqi oil flowing east.
- The spread between them tells you where the cheapest delivered barrel is — which in turn tells you where tankers will be loading next.
- When they move together, the market is calm. When they diverge, something structural is shifting.
Closing
There is no single price of oil. There are three benchmark prices, measuring three different oils, in three different regions, sold to three slightly different refinery systems.
For most readers, the headline number is enough. For anyone trying to understand what global shipping will look like next quarter — where the cargoes will move, which routes will tighten, which ports will get busier — the spreads between the three are the more honest signal.
The headline is the price. The spread is the story.