
On May 4, 2026, Brent crude jumped 5.8% to $114 per barrel, the highest level since mid-2022. On the same day, the Baltic Dry Index closed at 1,882, down 23% from its April peak of 2,450 and at a fresh six-week low. The two benchmarks that typically move in tandem are now telling sharply different stories. Reading that disconnect correctly is the difference between profiting from the next 90 days and getting caught by it.
The Two Numbers That Tell Different Stories
The historical correlation between crude oil prices and dry bulk freight rates is one of the most reliable patterns in maritime markets. Higher oil prices mean higher production, more energy trade volumes, more raw material movement, more demand for ships. Lower oil prices mean the reverse. The two lines on a long-term chart hug each other.
Until they don't.
Why They Usually Move Together
| Channel | Mechanism | Lag |
|---|---|---|
| Demand correlation | Strong oil price = strong industrial demand = more dry bulk trade | Real-time |
| Bunker cost passthrough | Higher oil = higher bunker = higher voyage cost = higher freight quote | 2–4 weeks |
| Producer surplus | Oil producers earn more, invest more in shipping infrastructure and trade | 3–6 months |
| Risk premium | Geopolitical tension lifts both as supply concerns rise across commodities | Real-time |
The four channels combined produce a typical correlation of 0.6 to 0.8 between Brent and BDI on monthly data. When that correlation breaks down — when oil rises while freight falls, or vice versa — one of the channels has been disrupted. Identifying which one tells you what comes next.
The Three Times They Diverged
Three historical episodes show what oil-freight divergence looks like and what it predicts:
| Period | Trigger | Pattern | Resolution |
|---|---|---|---|
| Aug 1990 | Iraq invades Kuwait | Oil +130% in 3 months, BDI flat then down | War, industrial demand collapse |
| Jul 2008 | Oil peaks at $147, financial crisis brewing | Oil +40% in 3 months, BDI peaked at 11,793 then -94% | Lehman collapse, demand vacuum |
| Mar 2020 | COVID lockdowns + oil price war | Oil -65%, BDI -50% (both fell together) | Demand shock |
| May 2026 | Hormuz crisis + UAE OPEC exit + China demand softness | Oil +30% in 8 weeks, BDI -23% in 2 weeks | Unfolding |
The 1990 and 2008 patterns are the most instructive. In both cases, oil prices spiked on supply-side concerns while industrial demand was already weakening. The freight market saw through the supply story to the underlying demand erosion. Within 6–12 months, oil collapsed as well.
The 2020 case is different — both markets fell together because the shock was demand-side. The current divergence in May 2026 looks more like 1990: oil rising on geopolitical supply concerns while underlying industrial demand (especially Chinese iron ore imports) is softening.
What's Different in May 2026
Three forces are pulling oil and freight apart simultaneously:
Force 1 — Geopolitical supply premium on oil. The Hormuz crisis, the UAE OPEC exit, the Fujairah hub fire, US-Iran missile exchanges. These are textbook oil supply shocks. They lift Brent without affecting actual physical supply much in the short term, because inventories and OPEC spare capacity buffer the immediate impact. But futures markets price in the tail risk.
Force 2 — Chinese iron ore demand weakening. Capesize earnings have collapsed because Chinese steel mills are running at lower utilization. Property sector remains weak. Infrastructure stimulus is targeted, not broad-based. This directly hits the BDI's most-weighted component.
Force 3 — Cape rerouting capacity absorption fading. The Cape of Good Hope rerouting that started with the Houthi attacks added effective ton-mile demand and supported freight rates through 2024–2025. By May 2026, the market has fully absorbed that adjustment. The structural lift is gone, leaving the underlying demand picture exposed.
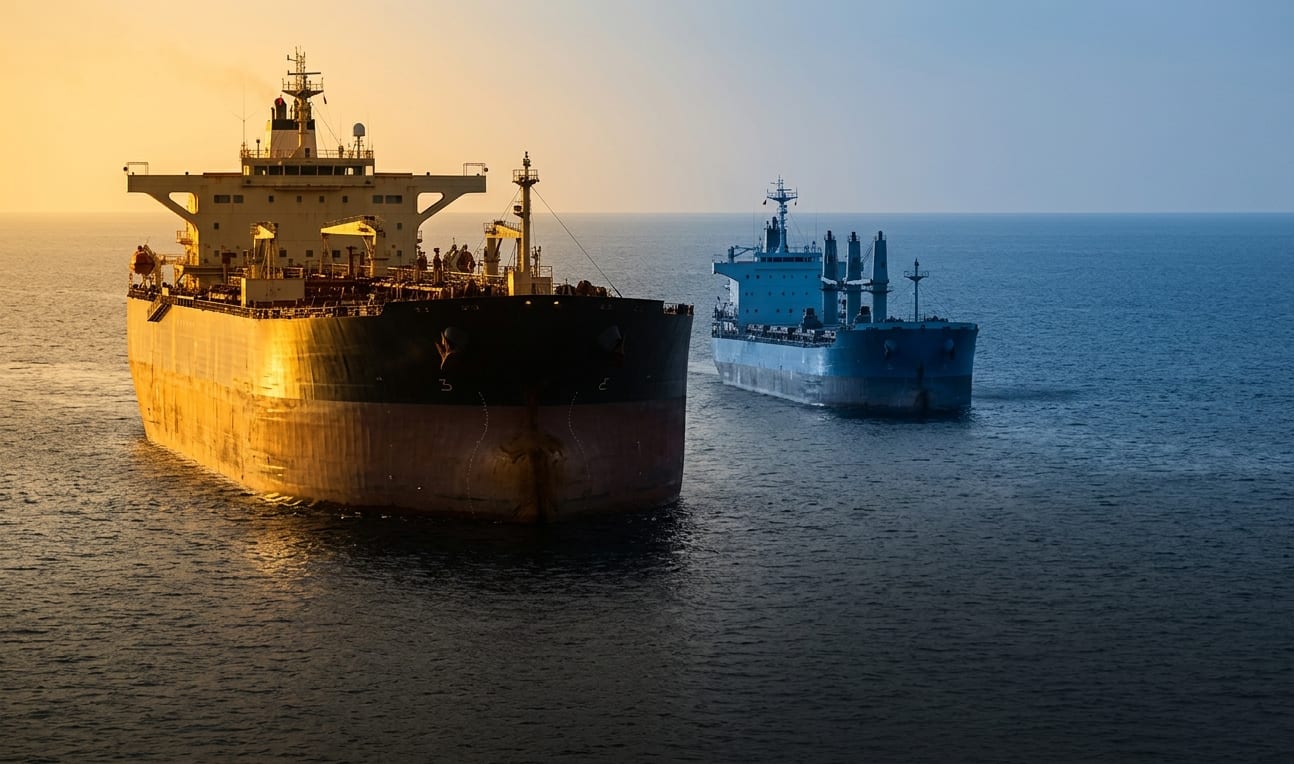
The Tanker-Bulker Split
The disconnect is not symmetric across shipping segments. Tanker markets are very much following oil higher. Dry bulk markets are following industrial demand lower. The split is what matters:
The pattern is clear: anything carrying oil benefits from the geopolitical premium and the longer voyage distances. Anything carrying iron ore, coal, and grain is exposed to softening Chinese industrial demand. Container sits in the middle — Cape rerouting helps, but underlying demand is mixed.
For voyage planners, this means the "average market" is a misleading concept right now. The relevant question is which segment your tonnage operates in and what cargo lane you serve. Real-time freight indices across all four segments are tracked daily on the Fairway ETA Data Hub.
Reading the Bunker Market

Bunker prices are the third data point that completes the disconnect picture. As of May 5, 2026:
| Port | VLSFO ($/mt) | Change vs Apr 30 | vs Pre-War (Feb) |
|---|---|---|---|
| Singapore | $785 | -1.9% | +62% |
| Rotterdam | $788 | -3.3% | +58% |
| Fujairah | $890 | -2.5% | +87% |
| Houston | $856 | -2.6% | +45% |
Bunker prices have moderated slightly from the late-April peak but remain dramatically elevated versus pre-war levels. With Brent at $114, bunker prices are likely to retest their April highs in coming weeks. For dry bulk operators, this is the worst combination: high fuel cost, falling freight rates. Margins compress from both sides.
The Cycle Implication
In our 2026 cycle diagnostic, we identified that shipping was in a tanker-led mid-to-late cycle with newbuild orderbook surge as the warning sign. The May 2026 disconnect is what mid-to-late cycle looks like in practice: tankers extending their boom on geopolitical premium, while early-cycle indicators (Capesize, iron ore demand) start to roll over.
Historical precedent says this pattern resolves in one of two ways: either the geopolitical premium fades and oil follows freight lower, or the demand softness intensifies and pulls everything down. The pattern is rarely "both stay where they are."
What Each Stakeholder Should Do

Concrete actions across roles:
For tanker owners and charterers: Lock in long-dated time charters at current premium levels. The geopolitical premium has historically faded faster than expected. WS 280 today is likely WS 180 by Q3 2026.
For dry bulk operators: Resist the urge to chase down. Capesize at this level is closer to bottom than top in cycle terms. If Chinese stimulus surfaces or iron ore prices stabilize, the snapback can be sharp.
For container operators: Watch the Cape rerouting decision closely. If carriers start meaningful return to Suez/Red Sea, container freight has another leg down. If Hormuz spillover keeps Suez closed, current rates hold.
For voyage planners across all segments: Update bunker cost assumptions weekly, not monthly. The volatility window is wider than the budget cycle.
For chartering brokers: The spread between 1-year and 3-year time charter rates is widening. Tanker owners want to lock in current premium for shorter periods. Charterers want the opposite. The negotiating leverage is shifting.
For investors and lenders: Tanker equities are pricing the boom. Dry bulk equities are pricing the crash. The pair trade — long bulkers, short tankers, hedged on Brent — is the contrarian setup if you believe the cycle resolves toward convergence.
Three Scenarios Through Q3 2026
| Scenario | Probability | Brent | BDI | Resolution |
|---|---|---|---|---|
| A. Convergence Down | 40% | $95–105 | 2,200–2,800 | Hormuz eases, oil softens, freight recovers |
| B. Continued Divergence | 35% | $110–125 | 1,500–2,000 | Geopolitical stays hot, Chinese demand stays weak |
| C. Synchronized Down | 25% | $80–95 | 1,200–1,600 | Demand shock catches up to oil, both fall together |
Scenario A — Convergence Down (40%). Most likely outcome. Hormuz tensions ease through diplomatic resolution or US-led escort operations. Oil normalizes back toward $100. Chinese stimulus filters through. Freight recovers modestly. Tanker boom moderates.
Scenario B — Continued Divergence (35%). Hormuz remains contested. UAE-OPEC fragmentation creates ongoing supply uncertainty. Chinese property crisis deepens. Tankers continue earning premium. Bulkers stay weak. Most painful for diversified fleets.
Scenario C — Synchronized Down (25%). The worst case. Demand shock from China contagion, Europe recession, or US tariff escalation catches up to oil. Both markets correct sharply. Cycle bottom forms.
The Bottom Line
Markets at inflection points tell their stories through divergences. Two numbers that should move together but don't — that is the signal. May 2026 is showing one of those signals. The interpretation depends on which channel of the oil-freight relationship has been disrupted, and how long it stays disrupted.
For the operators watching the right signals, the next 90 days are not a period of confusion. They are a period of clear positioning. Tankers earning premium. Bulkers near cycle floor. Bunker costs squeezing margins. Cape rerouting absorbing capacity. The strategy follows from the diagnosis. The diagnosis follows from the data.
That data is on the dashboard. The question is whether your decisions are using it, or only watching it.
Track Brent, BDI, BDTI, SCFI, FBX, bunker prices across 45 ports, and the newbuilding price index — all updated daily on the Fairway ETA Data Hub. Calculate fuel-optimized voyages with automatic SECA detection and EU ETS cost modeling on the Voyage Calculator.