Shipping is cyclical. Most operating decisions still treat the cycle as background noise.
Charters get fixed on spot signals. Newbuilds get ordered when yards are full. S&P deals get done at the top. Operators who time the cycle profit. Those who follow it lose.
Why the Cycle Matters More Than the News
The Hormuz crisis. UAE leaving OPEC. The MEPC 84 coalition. These are the headlines of spring 2026, and they matter — but they matter because of how they interact with the cycle, not as standalone events. A geopolitical shock in mid-cycle is a tailwind. The same shock late-cycle is a trapdoor. Reading the cycle is what tells you which one you are in.
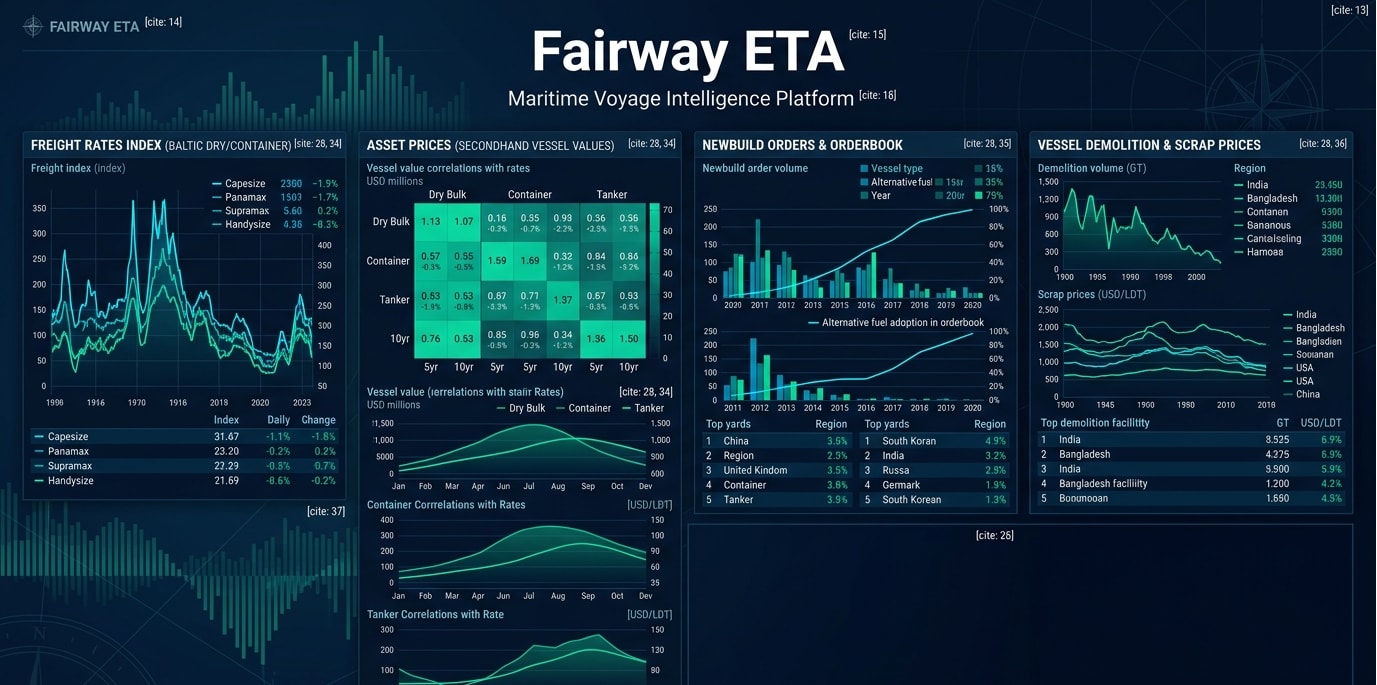
The cycle does not announce itself. It is visible in four numbers. Most operators watch only one or two. The ones who win — Greek owners, Norwegian funds, Japanese trading houses — watch all four, in sequence.
The Four Signals
Every cycle, in every shipping segment, leaves the same fingerprint. The signals appear in a recognizable order:
| Signal | What It Tracks | Where to Find It | Lag |
|---|---|---|---|
| 1. Freight Rates | Daily/spot earnings | BDI, BDTI, SCFI, FBX | Real-time |
| 2. Asset Prices | Newbuild and secondhand | Clarksons NPI, VV | 3–6 months behind rates |
| 3. Newbuild Orders | Capacity decisions | Orderbook reports | 6–12 months behind rates |
| 4. Demolition | Capacity exits | Scrap volumes | 12–18 months behind rates |
The pattern: rates spike → asset prices surge → newbuilds ordered → capacity arrives → rates collapse → demolition surges → capacity exits → rates recover. Each cycle takes roughly six to eight years end-to-end.
Cycle 1 (2003–2008): The Boom That Defined Modern Shipping
China's commodity supercycle drove the BDI from 2,000 in early 2003 to 11,793 by May 2008 — a 6x rise in five years. Capesize earnings hit $230,000 per day. Newbuild VLCC prices doubled from $75M to $158M. Yards in Korea, Japan, and China filled their orderbooks four years out.
The cycle ended in September 2008 within three weeks. Lehman collapsed. BDI fell from 11,793 to 663 by December — a 94 percent decline. By 2010, the orderbook from peak years was delivering. Owners who ordered VLCCs at $158M in 2008 took delivery in 2011 at the same price, into a market where a VLCC earned half what it cost to operate. Some never recovered.
Lesson: cycle peaks are not gradual. They turn fast. The signal was already in the data — newbuild orders peaked in late 2007 while rates were still rising. The four-signal framework called the top six months early. Most operators were not watching.
Cycle 2 (2010–2014): The Hangover
The 2008 supercycle's capacity hit the water in 2010–2013. The dry bulk fleet grew 15 percent in 2010 alone. Demand growth was 4 percent. The math killed earnings. BDI traded between 600 and 2,000 for four years. VLCC newbuild prices fell from $107M to $89M.
Demolition is what eventually fixed it. Scrap volumes hit a record 32 million dwt in 2012. Owners with strong balance sheets bought distressed assets at half newbuild price. The 2014 recovery in tankers was built on the bones of the 2010–2013 demolition wave.
Lesson: the bottom of the cycle is where multi-decade fortunes are made. Pacific Basin, Star Bulk, and DHT Holdings all timed their major secondhand acquisitions in 2012–2013. The buying signal was in the demolition data — when scrap volumes peak and asset prices stabilize, the cycle is bottoming.
Cycle 3 (2020–2024): Pandemic Whiplash
Everyone remembers the 2021 container boom. SCFI hit 5,109 in January 2022, a four-fold increase from pre-pandemic levels. Container ship asset prices doubled in 12 months. Carriers earned more in 2021–2022 than in the prior decade combined. By Q3 2022, every major liner had ordered massive newbuild programs.
What is less remembered is what came next. Newbuild deliveries hit historic highs in 2024. Container fleet grew 8 percent. Demand reverted. SCFI traded between 800 and 1,500 for most of 2024. The Houthi attacks and Cape rerouting absorbed some capacity. Without that, container freight would have collapsed harder.
Lesson: external shocks can mask cycle dynamics, but only temporarily. By late 2025, container rates were softening despite Cape rerouting because the underlying capacity oversupply was that severe.
Where We Are in May 2026
Apply the four-signal framework to current data:
| Signal | Current Reading | 12-Month Change | Cycle Position |
|---|---|---|---|
| BDI | 2,450 | +22% | Mid-cycle, firming |
| BDTI (Tanker) | 1,850 | +35% | Strong, late mid-cycle |
| VLCC Newbuild | $130M (Clarksons NPI, May 2026) | +6.5% | Elevated, near peak |
| LNG 174K Newbuild | $270M | +5.9% | Historic high |
| Newbuild Orders | Mixed | −44.5% YoY (Clarksons) | Orderbook at 15-year high |
| Demolition | Suppressed | Below trend | Mid-cycle confirmation |
The diagnosis: shipping in May 2026 is in a tanker-led mid-to-late cycle, with dry bulk firming, container easing, and newbuild prices at multi-year highs. The geopolitical premium from Hormuz, OPEC realignment, and Cape rerouting is real but layered onto an already firm market.
The warning sign is the newbuild orderbook. Q1 2026 set records — 38+ VLCC orders at one Chinese yard alone, plus 24 across Korean yards combined. That capacity arrives in 2028–2029. If demand softens in that window, history says the same actors who timed the recent ordering will be the ones with stranded slots and underwater charters.
The Geopolitical Wild Card
Cycles since 2020 have been increasingly distorted by external shocks. Pandemic, Suez blockage, Ukraine, Houthi attacks, Iran war, OPEC fragmentation. Each shock tightens or loosens capacity in ways the four-signal framework cannot predict.
For 2026–2027, three geopolitical variables compound cycle risk:
Hormuz resolution. The strait reopens fully — tanker capacity that was earning premiums on Cape rerouting normalizes. Earnings drop. Late-cycle warning becomes immediate.
EU ETS expansion. Combined EU ETS, FuelEU Maritime, and a possible IMO Net-Zero Framework add roughly $200–400 per tonne of fuel cost on European voyages by 2028, assuming EUA carbon prices in the €80–90 range and the standard CO₂-to-fuel conversion of ~3.1 t CO₂ per t fuel.
Trade war shifts. US tariff regimes, Chinese retaliations, and the political fragmentation discussed in our coverage of the 5-nation MEPC 84 coalition reshape trade routes. Longer voyages mean more ton-mile demand. Shorter or rerouted trades mean the opposite.
Three Scenarios for the Next 18 Months
Combining cycle diagnosis with geopolitical variables yields three plausible paths:
| Scenario | Probability | BDI Range 2027 | Asset Prices |
|---|---|---|---|
| A. Soft Landing | 35% | 1,800–2,500 | Stable, slight softening |
| B. Extended Boom | 35% | 2,500–3,500 | Continued rise, then plateau |
| C. Capacity Crash | 30% | 800–1,500 | Sharp correction |
Scenario A — Soft Landing. Hormuz reopens gradually, EU ETS phases in as planned, China demand stabilizes. Capacity from 2028 deliveries gets absorbed by retiring older fleet. Rates normalize but stay profitable. Asset prices ease 10–15 percent from current levels. Most balanced outcome.
Scenario B — Extended Boom. Hormuz remains contested through 2027, OPEC fragmentation accelerates, and a new geopolitical shock (Taiwan, Russia, or another Middle East flashpoint) extends the disruption premium. Cycle peak gets pushed out 12–18 months. Owners who hold positions earn record profits. Owners who fear the cycle and sell early miss the top.
Scenario C — Capacity Crash. Hormuz resolves abruptly. China demand weakens further. The 2028 deliveries hit a softer market. Earnings drop. Asset prices follow. Demolition surges in 2028. Brokers and lenders see distressed sales. Bottom of cycle establishes by mid-2028.
What Each Stakeholder Should Watch
The signal speaks to different roles differently. Three audiences face the most consequential reads:
- ▸Owners and operators — the asset-price signal sits at the dangerous end of the historical range. Newbuild contracting is timing the wrong end of the cycle for those committing now.
- ▸Charterers — the divergence between dry bulk and tanker means hedging assumptions built around correlated freight rates have stopped working. Long-dated cover prices a different set of risks than spot.
- ▸Lenders and investors — the gap between asset prices and trailing freight earnings is wider than at any point since 2008. Underwriting models calibrated to that correlation are now mispricing risk.
Building Your Own Dashboard
Four signals, watched together, surface the cycle's actual position more reliably than any single number does. Most operators already track two or three; the missing piece is usually the one that contradicts the others.
The freight indices and bunker prices feeding this analysis update daily in the Maritime Data Hub. The voyage-level implications of the divergence — where it shows up in routing economics — sit in the Calculator.
The Bottom Line
Shipping in May 2026 sits in a firm mid-to-late cycle, with tanker leading, dry bulk firming, container softening, and newbuild capacity at multi-year highs. The orderbook signal is the warning. The geopolitical premium is the wild card. The demolition data is the confirmation. All three are now visible.
What separates the operators who profit from the cycle from the ones who get caught by it is rarely intelligence or capital — it is discipline. The discipline to read all four signals together. The discipline to act on signals that contradict the headlines. The discipline to remember that every cycle ends, and every cycle restarts.
2026 is not the peak. It is also not the bottom. It is the inflection point where decisions made now determine which side of 2028 an operator stands on.
Track all four cycle signals — freight rates (BDI, BDTI, SCFI, FBX), newbuilding price index, bunker prices across 45 ports, and risk zones — on the Fairway ETA Data Hub. Calculate fuel-optimized voyages with automatic SECA detection and EU ETS cost modeling on the Voyage Calculator.