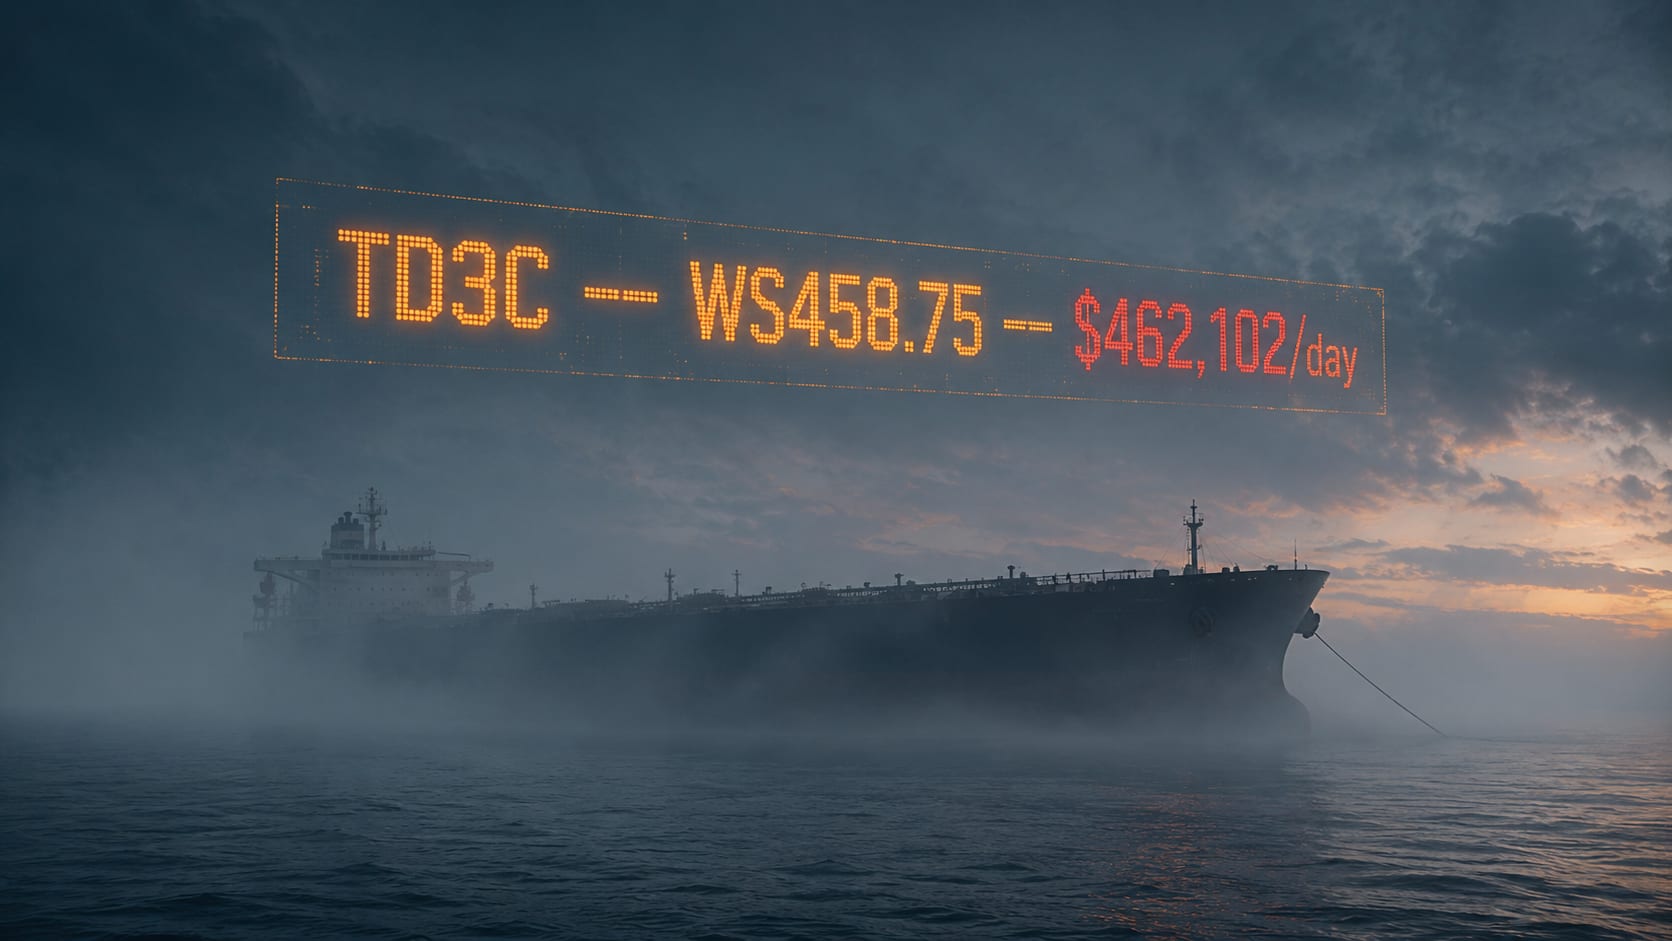
The Baltic Exchange's TD3C measures freight rates for VLCC voyages from Ras Tanura, Saudi Arabia, to China. On May 11, 2026, it printed $462,102 per day in Time Charter Equivalent terms — the highest reading since at least 2008. Ras Tanura has not been a viable VLCC loading port for much of the international market in weeks. The index is still being published every weekday.
This is not a malfunction. It is a methodology choice — a deliberate one, made by the Baltic and its panellists to keep the index alive through a period when the route the index names has effectively dropped out from underneath it. The TD3C has stopped being a description of reality. It has become an instrument that contracts react to, and that reaction is now louder than the underlying market it was built to describe.
What the TD3C Is, and What It Stopped Being
The Baltic TD3C is a route-specific freight assessment for a 270,000-tonne crude cargo loaded at Ras Tanura and discharged in Ningbo, China. Each weekday, a panel of brokers reports indicative spot rates. The Baltic publishes both a Worldscale percentage and a corresponding TCE in dollars per day. Charterers and owners reference the number constantly. It is the standard pricing input for the largest single trade lane in the crude tanker market.
That mechanism works as long as the route is open. Through late February 2026, it was. Vessels loaded at Ras Tanura, transited Hormuz, called at Singapore for bunkers, and discharged in Northeast Asia. Panellists assessed real fixtures on a real route, and the number reflected what the market was paying.
Since late February, that route has become commercially inaccessible for much of the international VLCC market. According to Western naval assessments and regional security reporting, IRGC-linked forces have been associated with multiple attacks on merchant shipping in or near the strait; Iran has publicly issued passage warnings; sea mines have been reported in the area, though the full picture remains contested. The US Navy imposed a counter-blockade on Iranian ports beginning April 13. Lloyd's List traffic monitoring, cited in subsequent reporting, found Hormuz transits had collapsed to roughly forty vessels for the entire week ending May 3, against a pre-crisis pattern of well over a hundred per day.
For owners with mainstream insurance cover, US-linked ownership, or charterers with sanctions-sensitive end-users, the route is not on the table. The number for that route, however, is still printed every day.
The Yanbu Workaround
To keep TD3C publishing through the closure, Baltic Exchange panellists have shifted to a reference framework. The Baltic confirmed the mechanism to Lloyd's List in March:
“Baltic panellists providing assessments for TD3C can reference Yanbu fixtures but they need to apply a risk premium that the owner could accept to transit inside the Strait.”
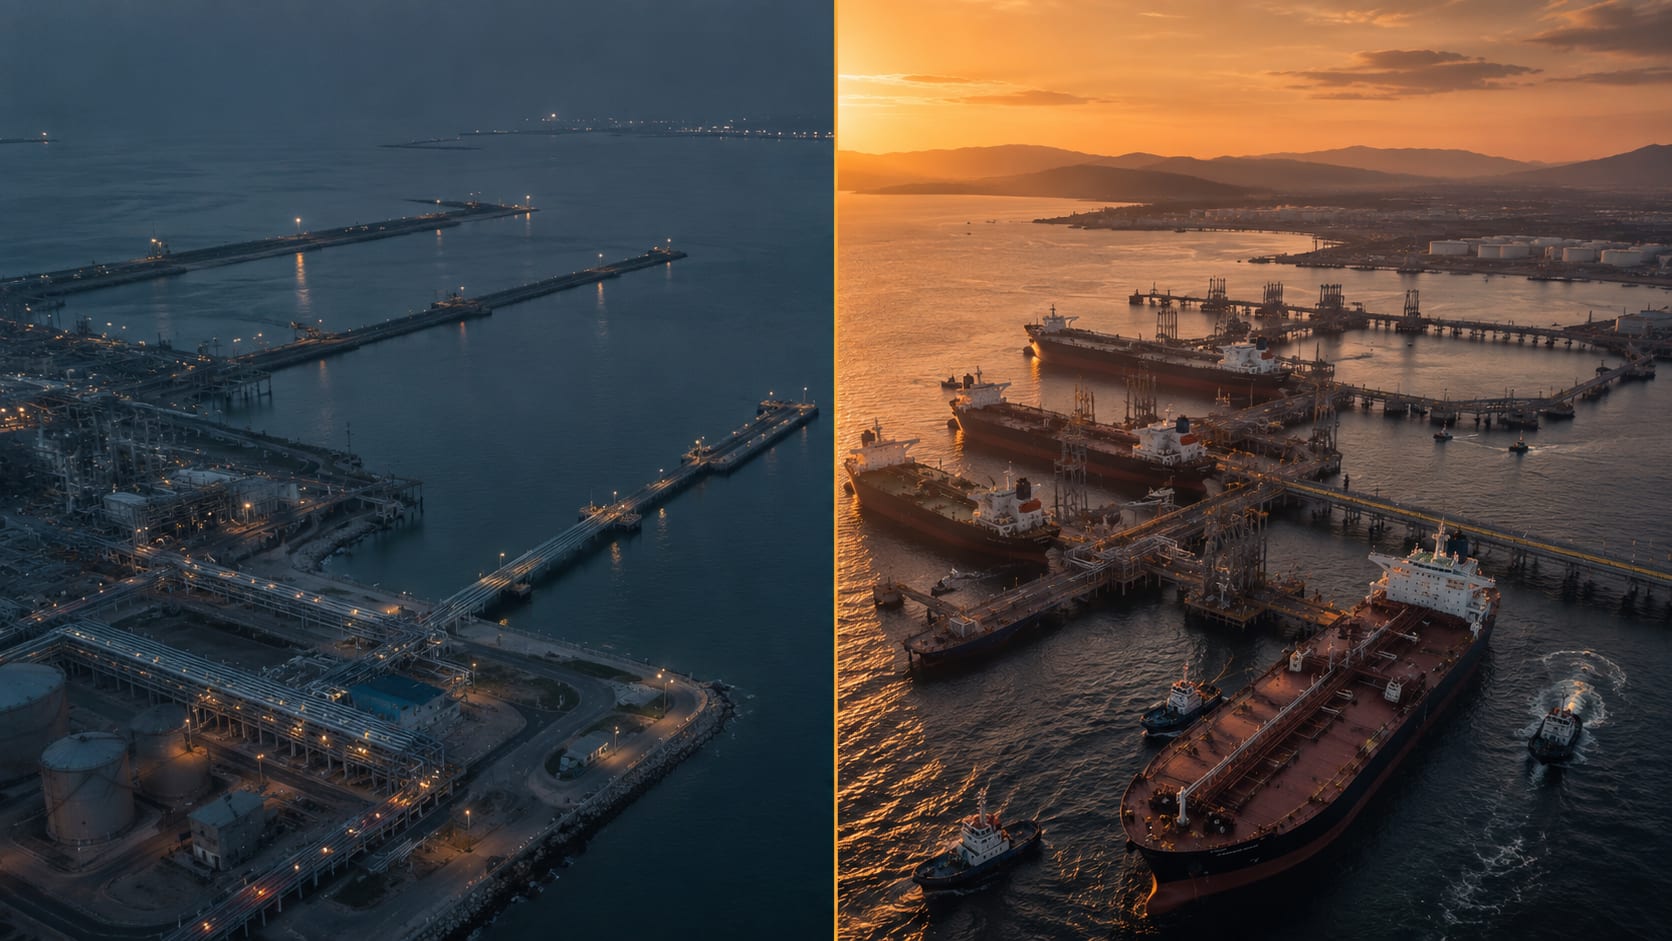
Yanbu is Saudi Arabia's main Red Sea export terminal. Cargoes loaded at Yanbu do not pass through Hormuz at all. They route south through Bab-el-Mandeb to Asian buyers, or via Suez and the Cape depending on the destination and the operator's risk posture. Exports from Yanbu rose from a typical 1 million barrels per day to roughly 3 million bpd through April, against port loading capacity of around 4.5 million bpd. The infrastructure is real. The cargoes are real. The route is not the route the TD3C names.
The daily TD3C number is now generated by taking a Yanbu fixture, adjusting for distance and voyage time differences, and adding a notional risk premium representing what an owner would charge if the strait were the actual transit. According to broker assessments cited in trade press reporting, actual Yanbu-to-East freight has cleared at the equivalent of around $13 per barrel. The TD3C on the same days has implied closer to $18 per barrel. The five-dollar spread is the running cost of the methodology choice. It is small enough to be ignored on any single fixture and large enough to matter when it propagates through hundreds of index-linked contracts.
The route in the index name no longer corresponds to the cargoes priced. That sentence, in any other year, would be a contradiction in terms. In 2026 it is the daily operating reality of the world's most-quoted tanker benchmark.
Three Clocks at Different Speeds
The Hormuz crisis has produced a recurring pattern across the maritime market: different layers price the same event at different speeds. Oil reacts in hours. Marine insurance reacts in weeks. Institutional structures — like Iran's PGSA toll regime, covered in The PGSA Toll Booth — run on a multi-year clock. Freight indexes were supposed to track the physical market closely, on the same clock as the cargoes themselves. They no longer do.
Cargoes actually loaded, transited, and discharged.
Frozen on the named route. Approximately 40 Hormuz transits per week against an ~840/week pre-crisis baseline (Lloyd's List data, cited in CNN reporting).
FFA positions, index-linked floating contracts, freight derivatives.
Parabolic. TD3C printed $462,102/day TCE on May 11. Forward curve prices Q3 2026 at roughly $23/MT, implying reversion by late summer.
The Baltic's daily assessment process.
Continued via Yanbu references plus a risk-premium overlay. The route is named Ras Tanura. The fixtures it reads are from elsewhere.
The paper market is where the real money sits. According to Frontline CEO Lars Barstad on the company's Q4 earnings call in February:
“We've seen the spread of index-linked floating contracts and surging FFA trading driven by the indexes... For every $200,000 per day fixture that is done physically, there is an exponential number of contractual obligations triggered.”
A single fixture moves an index. The index moves a fleet of paper contracts. The contracts move charterer and owner cash flows. None of it requires that the underlying voyage actually take place.
Why This Spike Is Different
TD3C has spiked before. March 2020, when COVID floating storage absorbed the global VLCC fleet. October 2022, when post-OPEC+ repositioning tightened the Atlantic basin. In each case, the index ran above $200,000/day for a stretch, then mean-reverted within a quarter.
Two structural differences make 2026 unlike either episode.
The first is that the index is no longer self-correcting. In past spikes, the route stayed open. As more tonnage repositioned to capture the rates, supply caught up with demand on the same route, and the number decayed naturally. Today, the route is closed. Supply cannot adjust on the route as named because no supply can sail it. The only thing that decays the number is the methodology — a choice made daily by panellists, not a market clearing mechanism.
The second is that the FFA market has grown materially in liquidity and in the share of contracts priced off the index rather than off fixtures. The forward curve currently prices Q3 2026 TD3C at roughly $23/MT — about half the current spot assessment. The market believes in reversion. The same market believed in reversion in March 2020 and was wrong on the timeline by months.
A supply-side shock — and Hormuz is a supply-side shock, not a demand event — does not unwind on a calendar. It unwinds on geopolitics. There is no current signal, from US-Iran negotiations or from Iran's PGSA toll regime, that the strait reopens with insurance market confidence by Q3.

Two Parallel Tracks
The disconnect has forced the chartering desk to operate on two tracks at once.
The first is the index track. Floating-rate contracts, index-linked Contracts of Affreightment, FFA hedges — these continue to settle off TD3C. There is no opt-out for parties already exposed. The exposure is managed by FFA short positions against physical longs, or simply absorbed as the cost of the methodology spread.
The second is the real-route track. Actual fixtures are negotiated point to point: Yanbu to Sikka, Yanbu to Ningbo via the Cape, Basrah to the Mediterranean, Salalah direct. The pricing references are bilateral and frequently opaque. Brokers quote these in absolute dollars per voyage rather than as Worldscale percentages, because the Worldscale baseline itself is built around routes that are not being sailed.
Somewhere in Singapore last week, a chartering desk priced a floating-rate VLCC fixture against a TD3C settlement neither party expected the vessel to actually sail through the strait. The contract was signed anyway. The settlement will print on schedule. The cargo will route via Yanbu. Three different numbers, one fixture — and that arrangement is now common enough that brokers no longer flag it.
The cleanest read on the current market is to look at all three numbers at once:
- TD3C: $462,000/day TCE — the contractual benchmark.
- Yanbu→East real fixtures: ~$13/bbl — the actual cost.
- Implied TD3C in barrels: ~$18/bbl — the institutional overlay.
Where the three converge depends on whether the strait reopens with insurance market confidence. Where they diverge is the running institutional cost of the methodology choice.
What This Means for the Next Sixty Days
Three observations, for operators planning into the back half of Q2 and Q3.
Index-linked contracts have stopped self-anchoring. Any contract that prices a future voyage at a percentage of TD3C is now priced against an index that runs on panellist judgment rather than on physical fixtures. The risk that needs managing is no longer pure freight risk. It is methodology risk.
The Q3 forward curve is a market opinion, not a forecast. The Baltic FFA market is pricing TD3C normalization by late summer. That price reflects what traders are willing to put behind their view. It does not reflect a forecast from the physical market, where the route the index names is still not being sailed. Operators with Q3 cargo to move should price forward on operational realism, not on FFA-implied reversion.
Yanbu is now a structural feature, not a workaround. Three million barrels per day moving through Yanbu is no longer overflow capacity from a temporarily closed Hormuz. It is the baseline that the global market has adapted to. The East-West Pipeline at 5 million bpd capacity, the persistent Yanbu congestion, and the lack of any short-term resolution to the strait closure all point toward this configuration outlasting the immediate crisis. The TD3C, as currently constituted, will keep pricing a route that has been functionally replaced.
Closing
Indexes are supposed to be passive. They observe a market. They do not change it.
The TD3C, today, is changing the market it was built to observe. The benchmark now moves faster than the route it was built to describe, and the contracts that reference the benchmark are settling on numbers the physical market does not produce. Until the strait reopens, or until the Baltic Exchange formally restructures the route, that gap is the daily operating reality.
The number prints. The route does not.