Market

Freight rate analysis, index divergence, oil price dynamics, shipping cycle diagnostics, and market structure reads.

9 articles

This section reads the freight and commodity markets without ceremony. Coverage includes shipping cycle diagnostics (where we are and what the orderbook signals), freight index divergence (when BDI and FBX stop moving together, the spread itself is the story), crude oil price dynamics and their transmission into tanker rates, and the structural market shifts — Hormuz repricing, shadow fleet supply removal, decarbonisation cost absorption — that define the current cycle.

Articles are written for readers who want the thesis before the data. The data follows.

The Price Has Two Layers — What Hormuz Reopening Removes and What It Does Not
Market10 min

The Price Has Two Layers — What Hormuz Reopening Removes and What It Does Not

Brent fell from $117 to $87. VLCC rates retreated from March's $424,000/day record. The risk premium is compressing. But the tanker rate has two layers — one driven by the Strait, one driven by the fleet. Remove the first and rates fall. The second is structural: the fleet is still ageing, deliveries still lagging, and 200 VLCCs remain outside the commercially available pool. The Strait sets the spike. The fleet sets the floor.

June 15, 2026
The Two Clocks of Shipping — Why FBX and BDI Stopped Moving Together
Market9 min

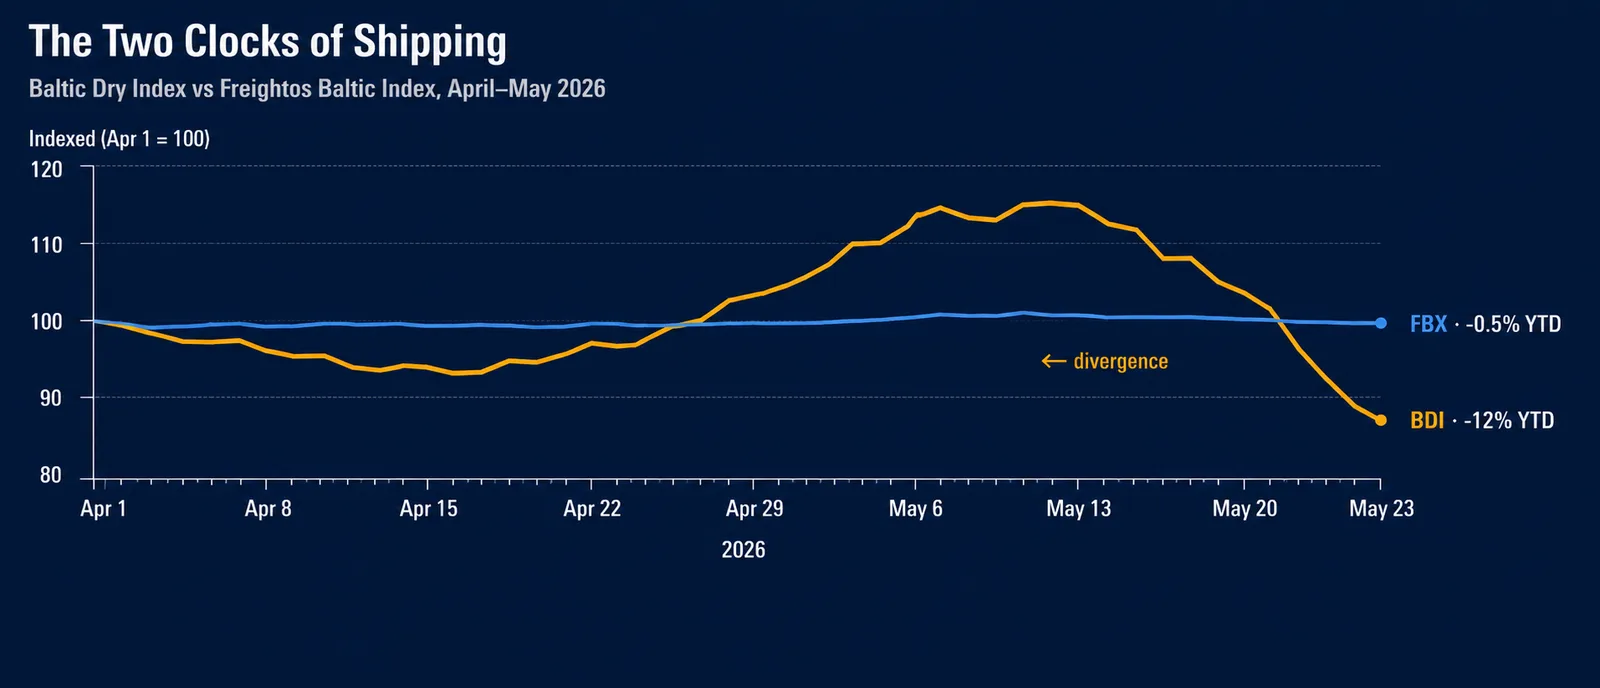
The Two Clocks of Shipping — Why FBX and BDI Stopped Moving Together

On May 22, the Baltic Dry Index fell 9% in a week. The Freightos Baltic Index — container shipping's benchmark, governed by the same Baltic Exchange — barely moved. Two indices, same exchange, two different markets. Maersk's Q1 2026 Ocean EBIT swung from +$743M to −$192M while dry bulk lurched on Hormuz peace narratives. Four freight benchmarks now run on four different clocks. The divergence isn't temporary. It's structure becoming visible.

May 23, 2026
Brent, WTI, Dubai — Why Oil Has Three Prices for the Same Liquid
Market7 min

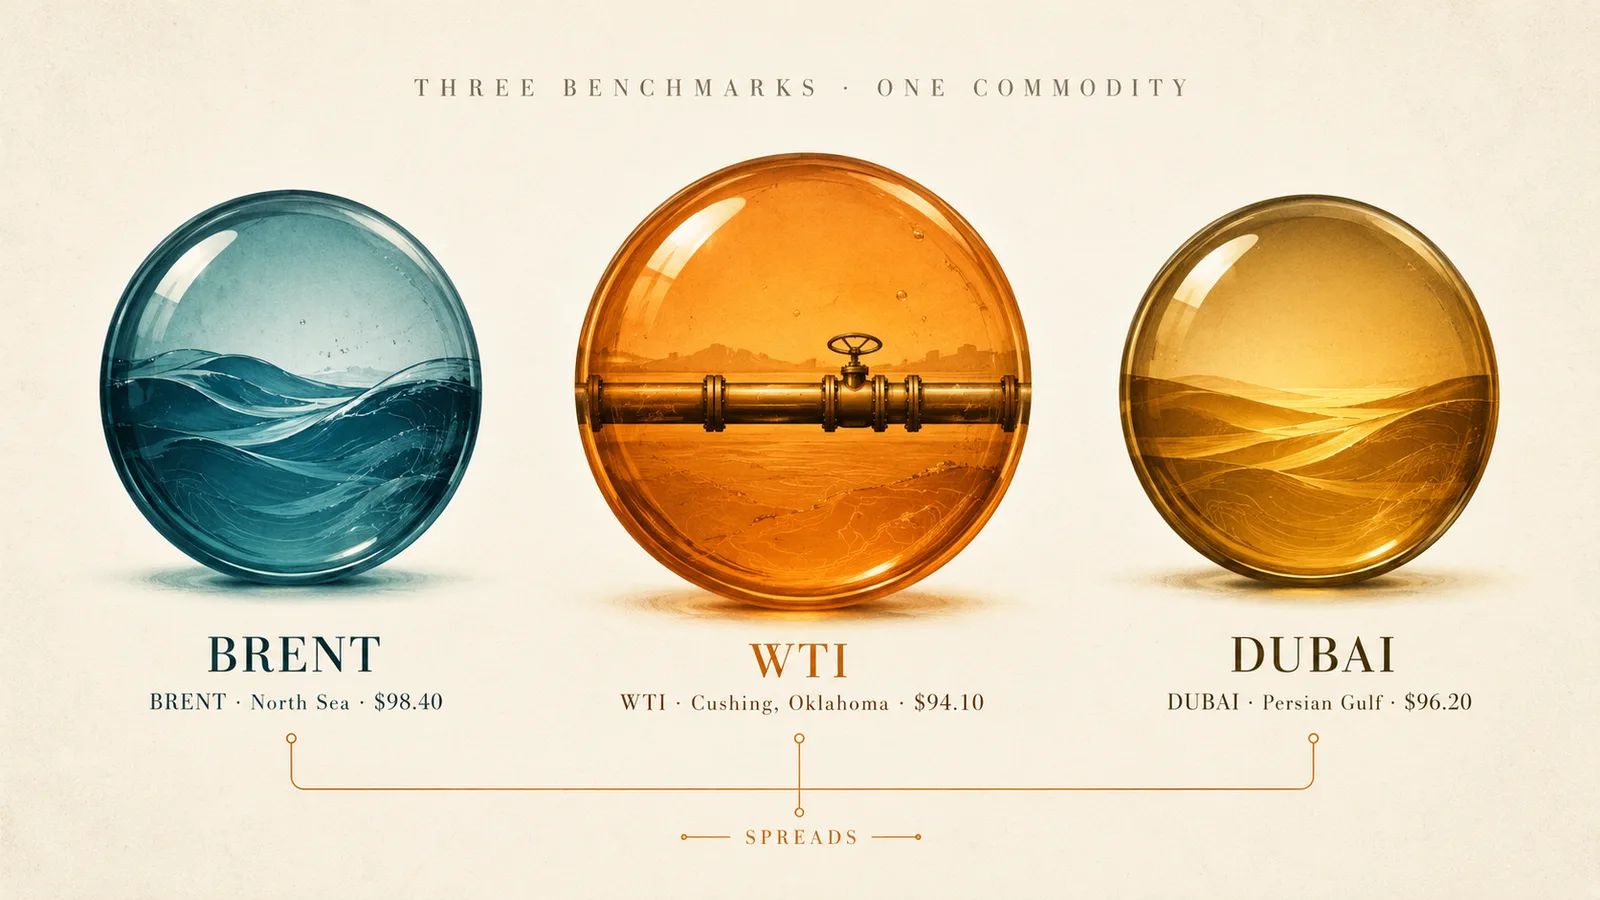
Brent, WTI, Dubai — Why Oil Has Three Prices for the Same Liquid

Open any energy feed and you'll see three oil prices: Brent, WTI, Dubai. They move together — mostly. The gaps between them quietly shape where the world's crude flows next quarter. A plain walk through what each benchmark actually measures, why they diverge, and what shipping desks read into it when they do.

May 19, 2026
Iron, Not Oil — What the Capesize Spike Is Actually Pricing
Market8 min

Iron, Not Oil — What the Capesize Spike Is Actually Pricing

The Baltic Capesize Index jumped 22% in three trading sessions this week. The intuitive read is that Hormuz is now spilling into dry bulk. The data says otherwise. Iron ore — not oil — is doing the work, and the difference matters for anyone pricing Q3 fixtures.

May 15, 2026
The Index That Doesn't Exist — What TD3C Is Really Measuring
Market9 min

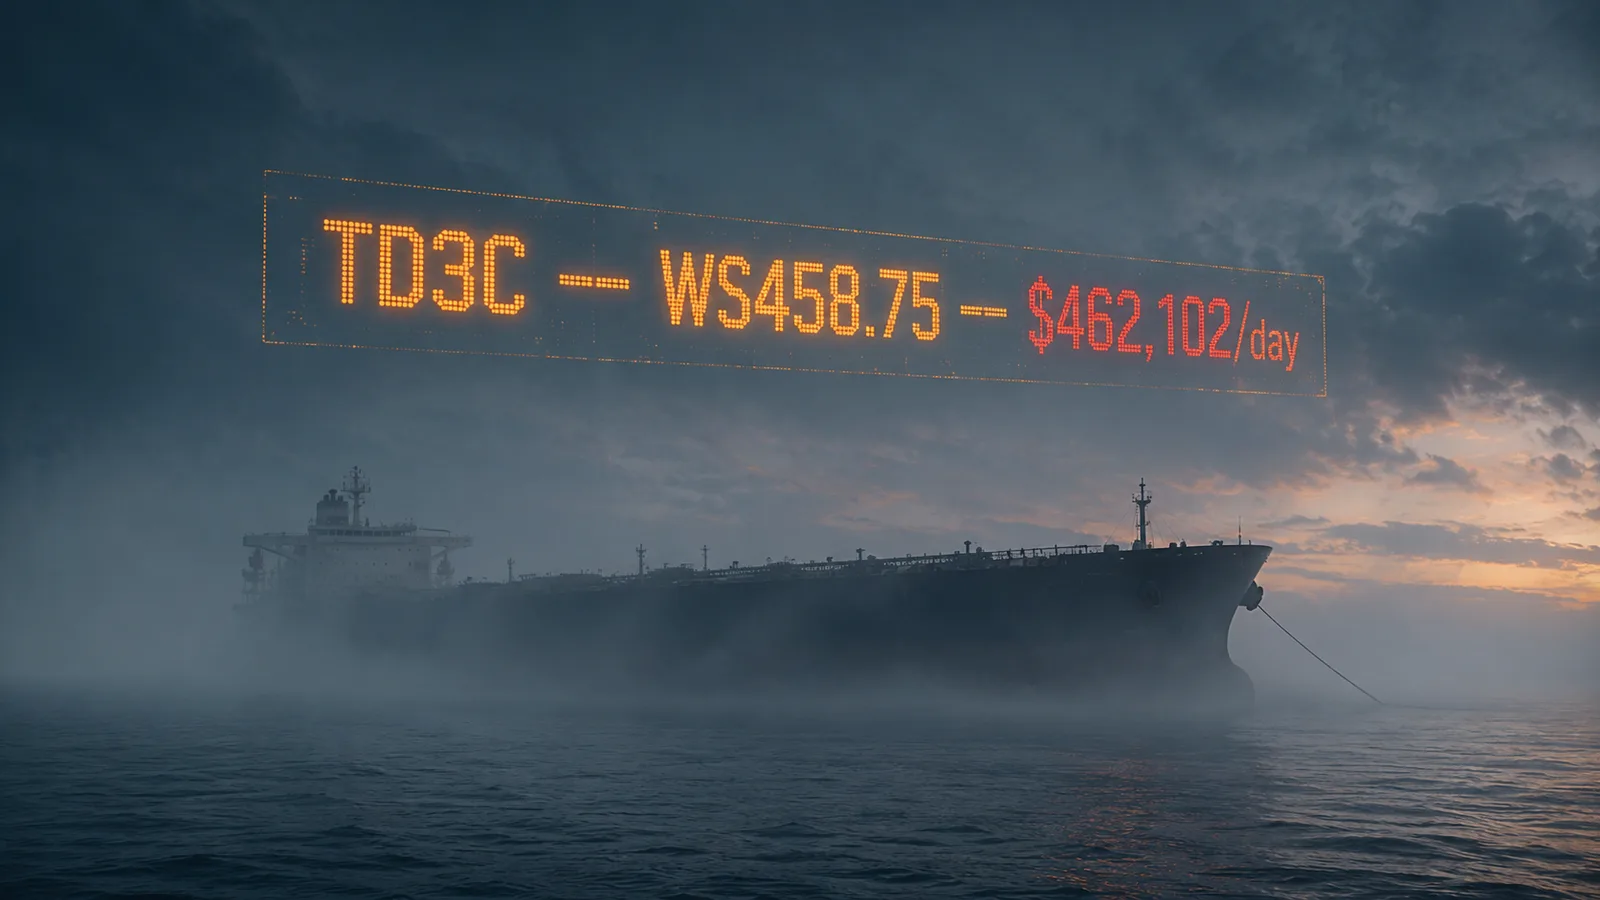
The Index That Doesn't Exist — What TD3C Is Really Measuring

The TD3C is the benchmark VLCC freight index for Middle East Gulf to China. On May 11, it printed $462,102 per day in TCE terms. The route it names — Ras Tanura to Ningbo — has been commercially inaccessible for much of the international market for weeks. The index has not stopped. It has changed what it measures.

May 13, 2026
The Brent in the Headlines Isn't Really Brent
Market6 min

The Brent in the Headlines Isn't Really Brent

Every day, energy headlines quote one number: Brent crude. It anchors pricing for roughly two-thirds of internationally traded crude oil. Here's the strange part — the original Brent oilfield is nearly empty, and the price you see is really a basket of five North Sea grades trading under one famous name.

May 12, 2026
The Locked Cycle — Why Newbuilds Are Dropping, Demolition Is Dying, and Hormuz Is Making Both Worse
Market14 min

The Locked Cycle — Why Newbuilds Are Dropping, Demolition Is Dying, and Hormuz Is Making Both Worse

Three things are happening at once: newbuilding orders fell 44.5% in 2025, ship demolition has collapsed to 25% of peak capacity, and a 17-year-record orderbook is about to deliver into both. The Hormuz crisis is not the cause — it is the catalyst freezing all three positions in place at the same time.

May 11, 2026
When Oil Spikes But Freight Falls: Reading the May 2026 Disconnect
Market12 min

When Oil Spikes But Freight Falls: Reading the May 2026 Disconnect

Brent at $114, BDI at 1,882. The two numbers usually move together. When they don't, the cycle is telling you something — and most operators are reading it wrong. A data-driven analysis of the tanker-bulker divergence and what it means for Q3 2026.

May 5, 2026
Where Are We in the Shipping Cycle? A 2026 Diagnostic
Market14 min

Where Are We in the Shipping Cycle? A 2026 Diagnostic

Reading the four signals that always tell you where the next 18 months are heading: freight rates, asset prices, newbuild orders, and demolition. A data-driven framework for shipowners, charterers, brokers, and investors navigating 2026 volatility.

May 5, 2026

Run the numbers yourself

Compare Suez, Cape, Panama, and NSR routes across 420+ ports. Free, no signup.

Launch Calculator →