
The current configuration of the world fleet is unusual on three fronts simultaneously. Newbuilding orders, demolition activity, and delivery pipelines are all locked in place by the same upstream cause. Newbuilding orders are dropping sharply in most segments. Demolition has nearly stopped. The delivery wave from the last ordering cycle is arriving at peak. And the Hormuz disruption — by reducing effective vessel availability across the Persian Gulf and tying up large numbers of ships in delays, rerouting, anchorage staging, and convoy waits — is helping keep all three of these unrelated trends frozen in place at the same time. That is not a coincidence of timing. It is the structural signature of a cycle that has locked.
Most of the trade press is reporting on each of these three movements separately. BIMCO publishes the quarterly contracting numbers. Clarksons publishes the orderbook composition. Al Jazeera writes the Alang human-interest story. Each piece is accurate within its frame. None of them, read in isolation, captures what the three of them together mean. This article attempts the cross-reference.
The Newbuilding Slowdown — What 44% Means
The aggregate numbers depend heavily on which metric is used. Clarksons reports 1,919 vessels totalling 88 million gross tonnes contracted between January and November 2025 — historically substantial, and still 24% above the 10-year average, but a meaningful step down from the elevated 2024 levels. The aggregate masks what is happening underneath. The segment breakdown is more revealing than the headline.
| Segment | YoY change | Comment |
|---|---|---|
| Aggregate | −44.5% | Steepest annual decline since 2020 |
| Dry bulk | −54% | 25m DWT through November, lowest since 2020 |
| Supramax | −76% | Already large orderbook, weak demand outlook |
| Panamax | −55% | Red Sea normalization risk depresses ordering |
| Product tanker | −66% | Crude tanker holding parity by contrast |
| Container vessel | Steady | Roughly half of all 2025 orders, dual-fuel led |
| LNG carrier | Strong | Korean yards dominant (20% global share) |
The pattern within the aggregate matters more than the aggregate itself. Container vessels and LNG carriers — the segments with clearest visibility on long-term demand — held up. Bulkers, supramax and panamax in particular, fell off a cliff. Tankers split, with product tanker ordering collapsing and crude tanker ordering holding flat. The pattern is what owners do when they are uncertain about specifically which markets will absorb supply over the next 5–8 years, which is the realistic delivery horizon for ships ordered today.
Adam Kent of Maritime Strategies International forecasts contracting will drop further toward roughly 50 million gross tonnes in 2026 — still historically substantial, but the lowest annual ordering since 2021. MSI sees 2026 and 2027 as the trough of the ordering cycle. “Owners are sitting on their hands,” Kent told Seatrade in January 2026. They are waiting to see what 2026–2027 actually looks like before committing capital to vessels that will not deliver until 2029.
And yet — and this is where the picture stops looking like a normal slowdown — the global orderbook is at a 15-year high. Clarksons reports 7,560 vessels totalling 316 million gross tonnes on order as of early December 2025, the highest level since 2010 in gross tonnage terms. The container sector alone holds roughly 33% of its active fleet on order; LNG carriers around 39% of fleet; tankers about 17%. Deliveries are scheduled to remain elevated through 2026 and 2027 as the contracts placed during the 2021–2024 surge work their way through yard backlogs. The newbuilding slowdown is real. The newbuilding delivery wave from the previous cycle is also real. Both are happening at once.
The Demolition Famine — When Ships Refuse to Die
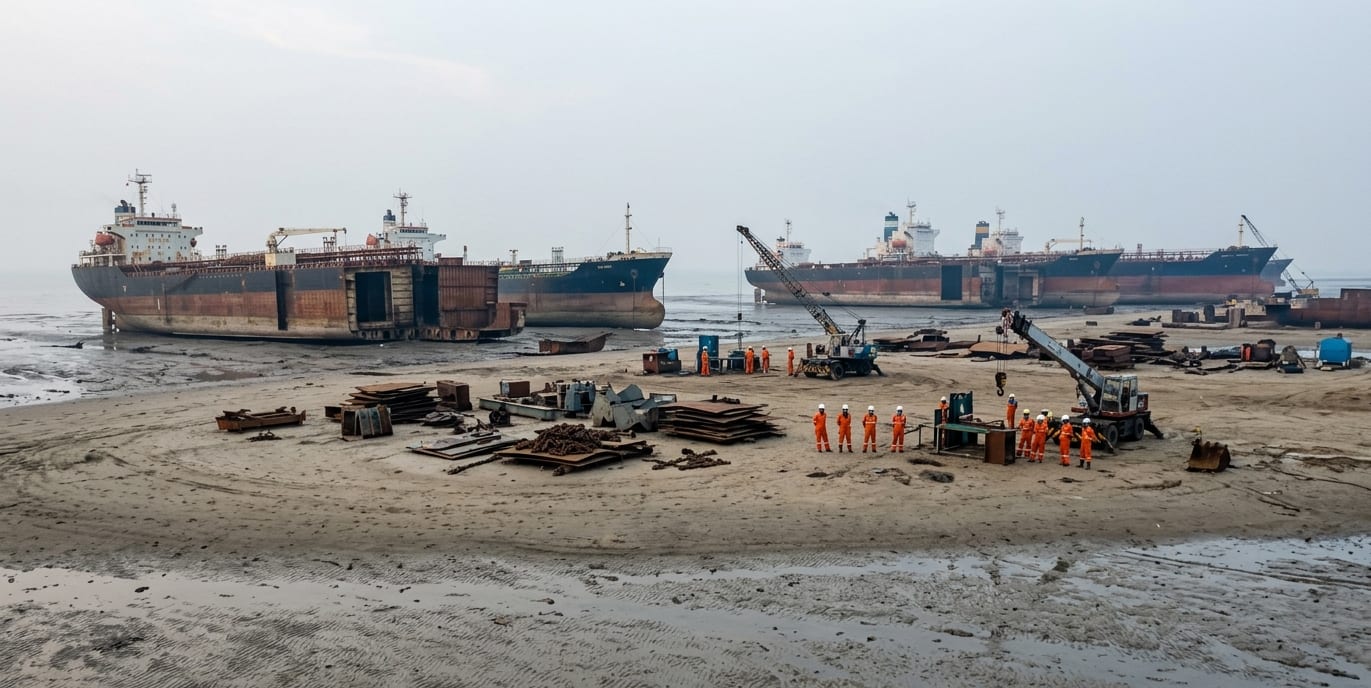
The other side of the equation sits in Gujarat. Alang — the world's largest ship-recycling yard, designed to dismantle up to 450 vessels a year at full theoretical utilization — recycled 113 ships in fiscal year 2024–25, the lowest annual figure since the 2008 financial crisis. By vessel count and active plot utilization, that puts the yard at roughly a quarter of historical peak activity by some industry estimates. Of the 150 plots, roughly 80 are operational; of those, only 25–30 currently have ships in process. The rest sit empty, with workers waiting for ships that are not arriving.
The reason is, perversely, that the shipping market has been too good. When freight rates are strong — and they have been, across most segments through 2024 and into early 2026 — even old, inefficient vessels remain profitable to operate. Owners earn more by sailing a 20-year-old bulker through another full year than they would by scrapping it. The result is a fleet that is aging in place rather than turning over.
The story repeats across South Asia. Gadani Ship-Breaking Yard in Pakistan, which dismantled 156 vessels in its 1980s peak year, processed no vessels in January 2026. Chittagong in Bangladesh is operating at a fraction of historical throughput. Together these three yards — Alang, Gadani, Chittagong — account for roughly 65–75% of global ship recycling in normal years. None of them are operating at normal volumes.
Meanwhile, the fleet is aging. Clarksons Research estimates that vessels reaching 25 years of age will rise from approximately 28 million deadweight tonnes in 2024 to roughly 100 million by 2035 — much of it older and less efficient. That is replacement demand. It is not yet replacement activity. The gap between the two is widening every quarter that scrapping stays suppressed.
The Delivery Peak — When the Last Cycle Still Pays Out
Then comes the part the market cannot easily stop: deliveries. Even as new ordering moderates and demolition stalls, the ships ordered three or four years ago continue to arrive on schedule. A ship ordered in 2022 delivers in 2025–2026. A ship ordered in 2023 delivers in 2026–2027. The peak delivery years from the 2021–2024 ordering boom land in 2026 and 2027 — the same window in which the segment-by-segment ordering slowdown bites hardest and demolition activity has been at multi-decade lows.
For the container sector specifically, the supply impact is severe. Veson Nautical's Q1 2026 forecast points to a 11.6 million TEU container orderbook, equivalent to roughly 35.5% of the existing fleet. Net fleet growth is projected to average 9.5% annually over 2026–2029. Freight rate forecasts for the same period reflect the math: a projected 8.5% decline in 2026, followed by a 17.6% decline in 2027. The deliveries are unavoidable. The ships were ordered three to four years ago and they are coming whether the market wants them or not.
For dry bulk, the dynamic is similar in shape but different in degree. The order-to-fleet ratio sits at about 11%, the smallest in years, which would normally suggest a tight supply outlook. But the existing fleet is aging without being replaced, with around 31% of the global merchant fleet now over 15 years of age (Clarksons). The deliveries coming over the next two years arrive into a market where the older tonnage that should have exited is still operating. Even in a sector where the formal orderbook looks moderate, the supply pressure builds on top of a fleet that has not turned over.
How Hormuz Locks the Cycle

The Hormuz crisis did not create any of these three trends. The newbuilding slowdown was already in motion through 2025. The demolition famine was already structural by 2024. The delivery peak from the 2021–2024 ordering wave was baked in. Since late February 2026, Hormuz has held all three in place at once — acting on each through a different mechanism.
None of these effects is permanent. The Hormuz disruption will eventually ease, in some configuration, and as it does the three locked positions will begin to unlock — but not in synchronized fashion. Demolition activity is likely to resume first, because the moment freight rates soften the marginal-operation calculus shifts quickly. Newbuild ordering will resume more slowly, because owners will want to see sustained visibility before committing 5–8 year capital. And the delivery pipeline from 2021–2024 orders is not subject to either lever — those ships are coming regardless. The unlock sequence, not the unlock itself, is what matters for operators planning fixtures into 2027–2030.
The Replacement Demand That's Building
The clearest measurable consequence of the current cycle is the buildup of replacement demand. Steve Gordon of Clarksons Research highlighted this explicitly in late 2025: with demolition volumes suppressed and the fleet continuing to age, deadweight tonnage reaching the 25-year mark is projected to roughly quadruple between 2024 and 2035. That tonnage will, eventually, need to be replaced. The current configuration is delaying that replacement, not eliminating the need for it.
What this implies for the medium term is a market that has been compressed. When the unlock begins, it will tend to unlock in clusters: a surge of demolition as scrap-bid economics suddenly favor it again; a wave of newbuild orders as owners catch up on replacement demand that has been held back for two or three years; and a stretched-out delivery profile from those orders landing into the late 2020s and early 2030s. The market will not return to its pre-2025 cadence smoothly. It will return in a sequence of overshoots.
In practical terms, commercial departments are freezing decisions that would normally already have been made. Chartering managers who expected to renew aging tonnage in late 2026 are extending surveys instead. Brokers describe owners asking for price ideas without requesting formal quotations. Some yards report a rise in what one would call "soft conversations" — preliminary inquiries that explore the option but never convert into signed contracts. This is what owner caution looks like from the desk level, beneath the aggregate numbers.
For owners and charterers, the operational implication is that fleet planning windows have changed shape. The standard 5–7 year planning horizon assumes orderly turnover and predictable replacement. Both of those assumptions are currently invalid. Whatever fleet renewal strategy was being executed in 2024 needs to be re-examined against a market structure in which the inputs to the renewal equation — scrap prices, newbuild prices, freight outlook, regulatory timeline — are moving at different speeds for different reasons.
What This Means for Charterers, Owners, and Yards
- For owners: The decision to hold older tonnage in service is currently being subsidized by Hormuz-disrupted freight rates. That subsidy is unlikely to persist past 2027 in its current form. Owners running marginal-economics vessels should model the scrap-bid scenario for the post-normalization environment, not the current one.
- For charterers: The container sector is on track for material rate decline in 2026–2027 as the orderbook delivers into a market where aging tonnage has not exited. Fixed-rate commitments at current levels may carry forward better than the spot market will, particularly on routes least affected by Hormuz redirection.
- For yards: Chinese yards captured 70% of Q1 2026 orders. South Korean yards held 20%, largely on LNG carrier strength. The competitive gap is widening rather than narrowing. Korean and Japanese yards pursuing US and Indian joint-venture pathways (HD Hyundai with Cochin, Hanwha with Philly) are positioning for a geopolitical hedge against Chinese dominance — but that hedge takes years to mature, not quarters.
- For voyage planners: The fleet age distribution affects bunker consumption profiles, EU ETS exposure, and CII rating outlooks across most operational segments. Aging-in-place vessels will increasingly fall on the wrong side of compliance thresholds. Fixtures into 2027 should price that risk explicitly rather than assuming current operating economics will persist.
- For insurance and finance: The mismatch between long-tenor newbuild commitments and short-term geopolitical visibility complicates hull-and-machinery underwriting, mortgage covenants, and resale-value assumptions. Most existing models are calibrated to a more orderly fleet renewal cycle than the one currently operating.
The Bigger Picture
The clean way to read 2026 is that maritime markets have entered a structural anomaly. Three independent trends — declining newbuild contracting, collapsed demolition activity, and a peak delivery wave from prior orders — would each, on their own, be notable. Their simultaneity is the more important observation. And the Hormuz crisis, while not the structural cause of any one of them, is the catalyst keeping all three locked in their current positions for as long as it persists.
For operators, the temptation is to treat this as a transitional period that will resolve when the geopolitical headlines settle down. That framing underestimates how much of what is currently happening will outlast the headlines. The orderbook from 2021–2024 is delivering regardless of who controls the strait. The aging fleet that needs replacing is real regardless of who is winning the May 2026 diplomatic round. The container freight decline in the forward curves is mathematical, not political. The Hormuz crisis is delaying the unlock. It is not changing the underlying inputs to the unlock.
The operators most likely to navigate the next eighteen months successfully are the ones who treat the current period as a structural pause rather than a holding pattern — who understand that decisions deferred now will, when they resume, resume in clusters rather than smoothly, and who position their fleet, their fixtures, and their financial structure for the unlock sequence rather than for the current freeze.
Reading List
For the engineering and diplomatic analysis of the May 4 HMM Namu incident, see The Engineer's Verdict. For the institutional toll mechanism the Hormuz crisis produced, see The PGSA Toll Booth. For the redistribution of trade friction into alternative corridors that the disruption is creating, see The Friction Doesn't Disappear — It Just Moves. For the diplomatic and oil-market two-clock framework that underlies the May 6 reset, see The Ceasefire That Isn't. For the original Hormuz crisis brief, see Hormuz Crisis 2026: How Shipping Routes Are Adjusting.
Live data on Brent, WTI, Dubai, BDI, bunker prices across major ports, and newbuilding and secondhand vessel price references is updated daily on the Maritime Data Hub. For voyage cost modelling that incorporates current war risk assumptions across Suez, Cape, Panama, and NSR routes, use the Ship ETA Calculator.