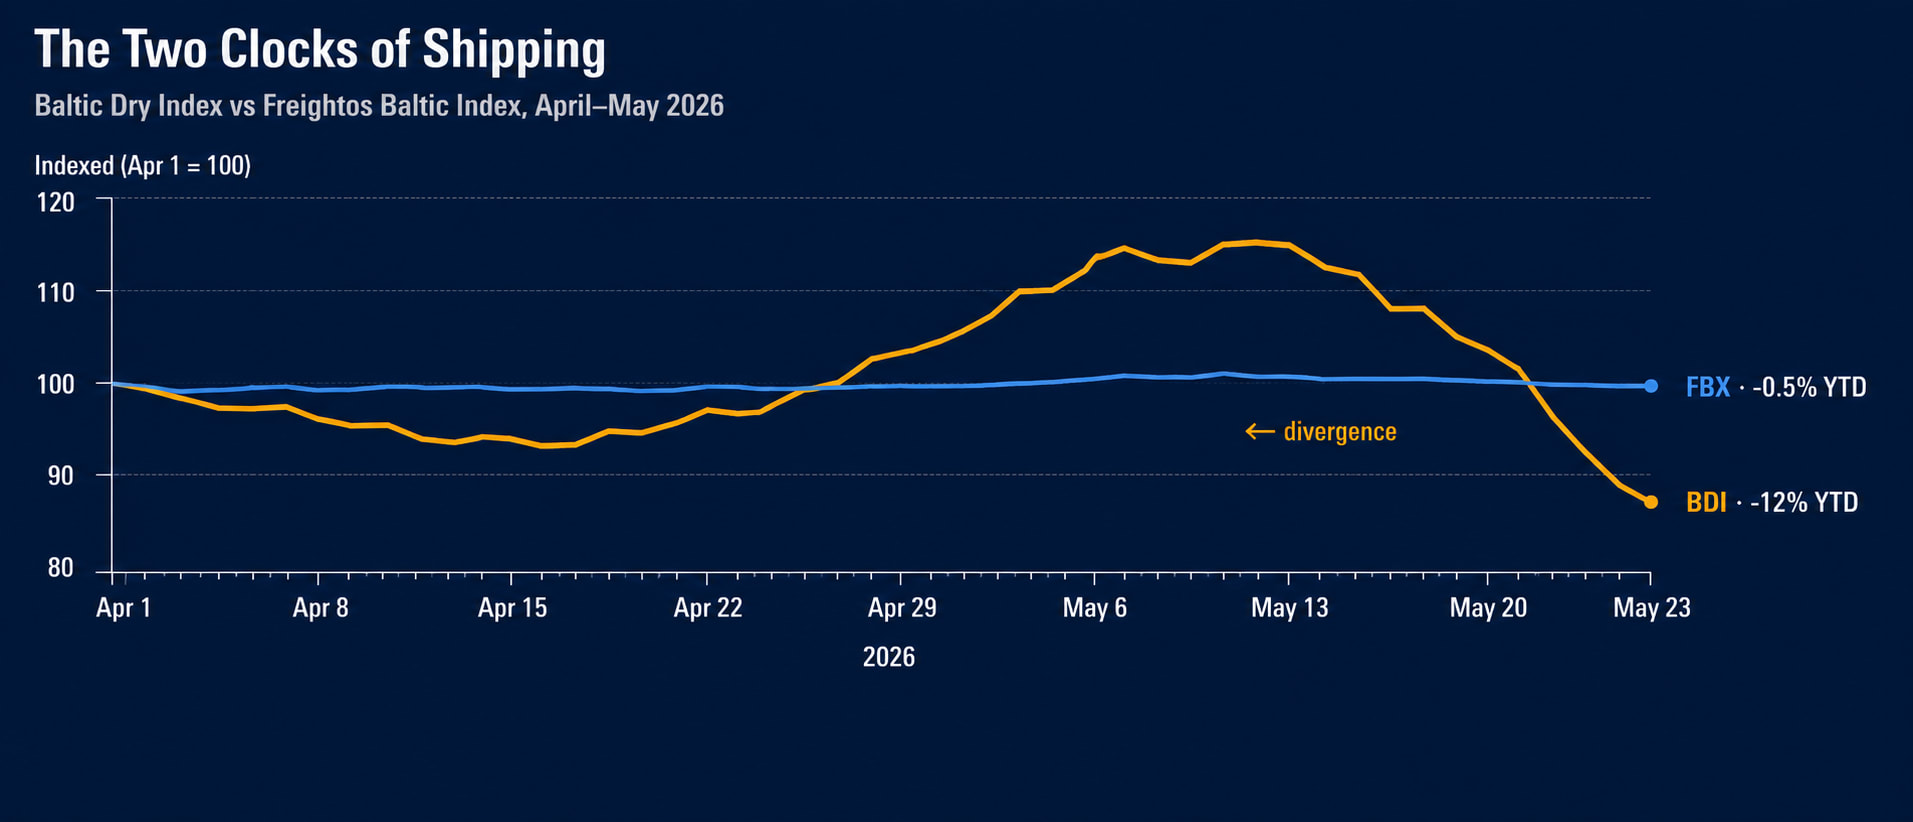
On May 22, the Baltic Dry Index fell 9% in five trading days. Capesize daily earnings dropped from roughly $41,000 to $36,000. Iron ore demand looked soft, Hormuz de-escalation hopes pulled Brent down 7% on the week, and the entire dry bulk freight market reset lower.
The Freightos Baltic Index — the container shipping benchmark, governed by the same Baltic Exchange — barely moved. FBX printed around 1,946 at the start of the week. By Friday it stood at roughly 1,955.
Two indices. Same exchange. Same week. Completely different markets.
This used to be unusual. For most of the post-2020 cycle, container rates and dry bulk rates moved in roughly the same direction because they were responding to the same upstream signal: global economic activity. When trade volumes rose, both segments rose together. When demand contracted, both contracted. The correlation wasn't perfect, but it was visible.
In 2026, the two indices have stopped moving together. The reasons matter — both for understanding what's happening in shipping right now, and for reading the next twelve months.
What the Two Indices Actually Measure
The BDI and the FBX look similar from a distance. Both are daily-published freight indices. Both are operated under the Baltic Exchange. Both publish in dollars and track the cost of moving cargo across global ocean lanes.
But the cargo is fundamentally different.
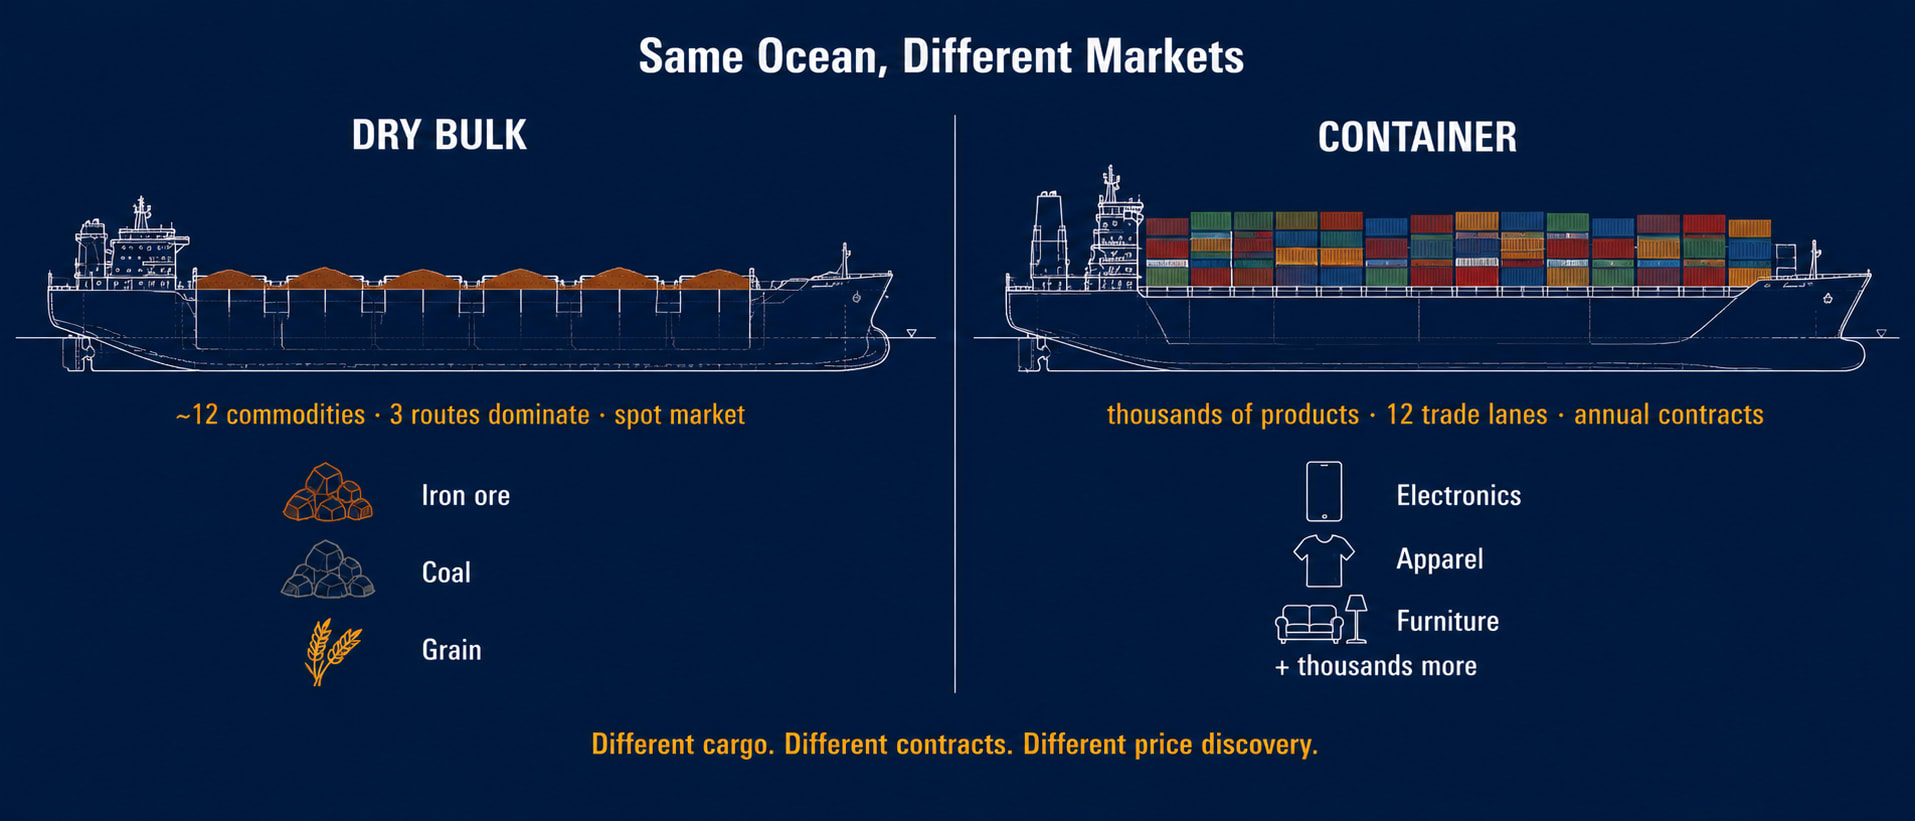
The BDI is a composite of three sub-indices measuring time-charter rates for dry bulk vessels — Capesize, Panamax, Supramax. The cargo is raw materials in bulk: iron ore from Brazil and Australia, coal from Indonesia and Newcastle, grain from the US Gulf and South America. The rate is what a shipowner earns to charter a ship for a voyage or a period of time, measured in dollars per day.
The FBX is a composite of twelve trade-lane spot rates for 40-foot containers (FEU). The cargo is manufactured goods: electronics, apparel, machinery, furniture, processed food. The rate is what a shipper pays to move one container from a port in Asia to a port in Europe, or from China to the US West Coast.
These are two different businesses on the same ocean. One moves the inputs to industrial economies. The other moves the outputs. They share infrastructure — ports, canals, fuel suppliers, crew — but their demand drivers diverge significantly once you look past surface-level “trade growth” framing.
That divergence has always existed. What changed in 2026 is that it's now visible at the index level on a weekly basis.
Why Dry Bulk Moves So Hard
Three things explain BDI volatility in 2026, and none of them have direct equivalents in container shipping.
First, single-commodity dependency. Capesize vessels dominate the long-haul iron ore trade. Australia and Brazil together account for roughly 78% of global seaborne iron ore supply, and China absorbs about three-quarters of the imports. When Chinese steel demand shifts — and it has been shifting through Q1 and Q2 2026 — Capesize rates respond first. The Baltic Capesize Index tends to dominate BDI movement because of the sheer cargo volumes involved. So when iron ore moves, BDI moves.
Container shipping has no equivalent concentration. The FBX tracks 12 trade lanes and dozens of cargo categories. No single commodity dominates the way iron ore dominates dry bulk. A weather-related slowdown in Chinese furniture exports might dent one lane but won't move the global index meaningfully.
Second, fleet supply inertia. Bulk carriers take two to three years to build. When demand spikes, supply can't respond immediately. When demand fades, ships can't easily exit either — demolition is slow and cyclical, and most owners would rather lay up a vessel than scrap it. The Capesize orderbook stands at roughly 8% of the existing fleet, and the average age of vessels loading at Western Australian hubs has drifted from around 6 years in 2017 to over 10 years today. That mismatch between fast demand and slow supply is the reason the BDI can lurch 20-30% in a week. The market is constantly trying to clear a ratio that can't quickly adjust.
Container shipping has the same physical constraint, but the demand side is different. Container demand reflects manufactured goods inventory cycles — buyers stockpile, then destock. Those cycles are slower than commodity demand cycles. Inventory destocking takes quarters, not weeks. The result: container rates move slowly because the demand itself moves slowly.
Third, distance matters more for dry bulk pricing than for containers. A Capesize tied up on a 40-day Brazil-China round voyage is unavailable to the Pacific market for weeks longer than an Australia-China run. That “effective supply” effect — what the dry bulk market calls ton-mile demand — is one reason Brazilian iron ore flows tend to move freight rates more sharply than Australian flows, even when the volume changes are similar. CMB projects seaborne iron ore ton-miles to rise around 2.8% in 2026 — small in volume terms, large in supply impact.
Container shipping prices on annual contracts, surcharges, and operational adjustment. The pass-through is slower. Hormuz tension creates a complex picture for container carriers — the rerouting from Suez to Cape of Good Hope started in 2023 and has been priced into schedules since then. A sudden de-escalation doesn't immediately translate to lower container rates because the operational infrastructure (longer routes, more ships needed, higher bunker exposure) is already committed.
What the Container Market Is Actually Doing
The container market in Q1 2026 told a different story than commodity markets. The major carriers reported results in May, and the picture was striking.
Maersk's Ocean business — its container shipping division — posted an EBIT loss of $192 million in Q1 2026, a swing from a $743 million profit in Q1 2025. The carrier's own characterization, in its 7 May interim report, was that continuing market pressure on rates drove the result. Average loaded freight rates dropped to roughly $2,081 per FEU, down 14% year-over-year. Container volumes grew 9.3% — strong by any measure — but rates were too low to cover unit costs at the gross level. The CEO summary: more cargo, less margin.
Hapag-Lloyd, the world's fifth-largest container carrier, swung from a $469 million Group profit in Q1 2025 to a $157 million Group EBIT loss in Q1 2026. Group net loss reached $256 million. The Liner Shipping segment EBIT swung to negative $174 million. Average freight rate: $1,330 per TEU, down 9.5%. Volumes fell about 1%. The CEO publicly described the quarter as “unsatisfactory,” citing weather disruptions and the Hormuz situation alongside rate pressure. Four Hapag-Lloyd vessels were reportedly stuck in the Persian Gulf as of late April.
These are not the same market.
The carrier story is consistent across the industry: high volumes, falling rates, narrowing or negative margins. This is what an oversupplied market looks like. New container vessel deliveries — particularly the 18,000+ TEU dual-fuel newbuildings — have arrived faster than demand has absorbed them. Maersk itself ordered eight new 18,600 TEU dual-fuel ships in Q1 for delivery in 2029-2030, which says something about strategic positioning but doesn't help current rates.
Maersk's own guidance for full-year 2026 EBIT ranges from negative $1.5 billion to positive $1.0 billion. Hapag-Lloyd's range is similar: negative $1.5 billion to positive $0.5 billion. Both ranges span $2 billion or more for a single year at two of the most disciplined container operators in the industry. The width of those ranges is the story. It reflects industry overcapacity, and timing uncertainty around when (or whether) Red Sea and Hormuz trading conditions normalize.
That uncertainty is fundamentally different from what dry bulk owners are pricing right now. A Capesize owner cares about one thing in the next 90 days: where Chinese iron ore demand goes. A container line operator is balancing capacity, fuel costs, routing decisions across 12 major trade lanes, and a regulatory environment — Section 301 fees, IMO Net-Zero Framework, EU ETS — that affects unit economics across every voyage.
The Structural Divergence
Pulling these strands together, the FBX-BDI divergence comes down to four structural factors.
Cargo composition. Dry bulk is dominated by a small number of commodities concentrated on a small number of routes. Container shipping is fragmented across thousands of product categories and dozens of trade lanes.
Contract structure. Dry bulk operates predominantly on the spot market and short period charters. Container shipping operates on a mix of spot, contract, and annual freight agreements with major shippers. Container rates therefore move more slowly because annual contracts smooth out short-term price signals.
Capacity flexibility. Container carriers can slow-steam, blank sail, reduce frequency, or reroute. They have operational levers to manage capacity that bulk carriers don't have. A Capesize either sails loaded or sits in port. A 20,000-TEU container vessel can sail at 75% utilization, adjust speed, and absorb capacity differently.
Geopolitical pass-through. Dry bulk passes geopolitical risk through to rates almost immediately because the spot market is so liquid. Container shipping passes risk through more slowly, through surcharges, contract renegotiation, and operational adjustment.
The divergence isn't a temporary mismatch. It's the result of two markets that have always had different mechanics, finally producing visibly different signals on the same week.
Why This Matters for Reading Shipping in 2026
The practical implication: looking at one index to understand “shipping” in 2026 will mislead you.
If you read BDI -9% and conclude “shipping demand is weak,” you're conflating dry bulk with container. Dry bulk freight rates can be soft while container shipping rates hold up — and vice versa. This was generally not true in 2020-2023. It is true in 2026.
The dry bulk story right now is iron ore. Specifically: Chinese steel demand, Brazilian export volumes, and ton-mile elasticity. If Chinese steel construction recovers in H2 2026, BDI rallies. Capesize daily earnings move back above $40,000. The Brazil-China benchmark C3 lifts from around $30/tonne. If steel demand stays soft, the BDI drifts.
The container story right now is capacity. Carriers ordered too many ships in the post-pandemic boom, deliveries are still arriving, and demand growth (2-4% annual, per Maersk's own outlook) cannot absorb supply growth. Container rates won't recover meaningfully until either deliveries slow or carriers idle capacity through scrapping, lay-up, or scheduling discipline.
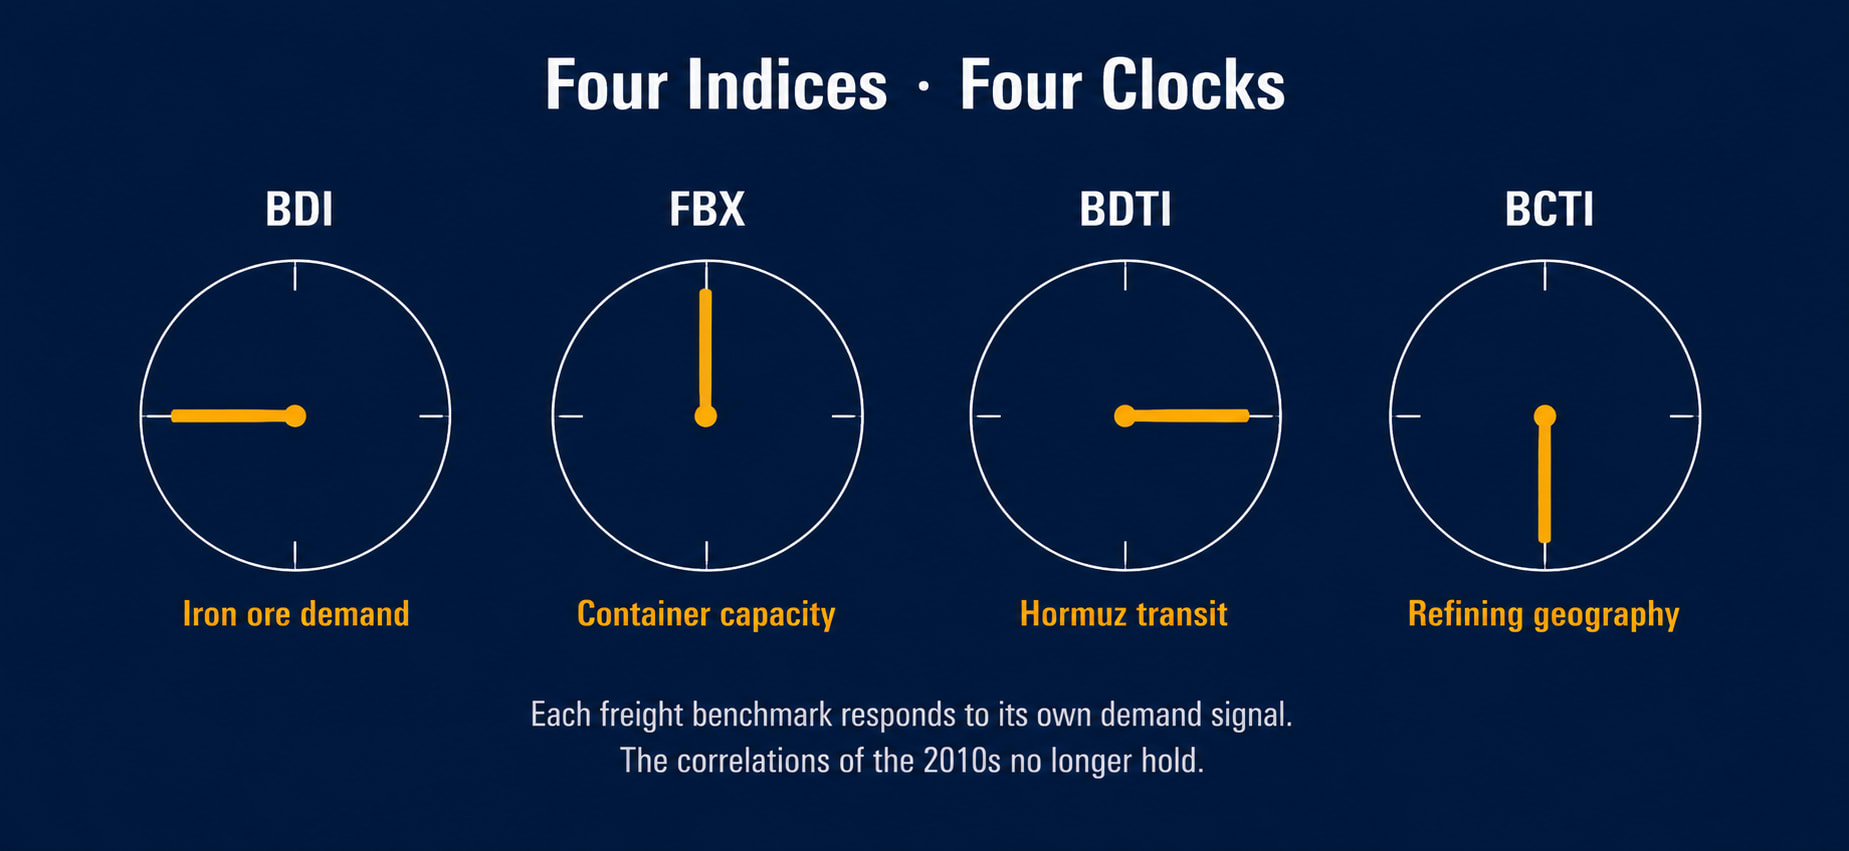
The tanker story is yet another clock — driven by Hormuz transit volumes, Russian oil flows, and refining geography. The Baltic Dirty Tanker Index fell roughly 4.5% on Hormuz peace narratives this week. The Clean Tanker Index moved barely 1%.
Four major freight benchmarks. Four different clocks. Each clock is responding to its own demand drivers, supply constraints, and geopolitical pass-through.
What to Watch in Q3 2026
Three signals will tell you whether the divergence persists or starts to converge.
First, Chinese property and steel demand. If Beijing pushes through meaningful stimulus and steel demand recovers, BDI rallies. Capesize rates rise. Iron ore C3 (Tubarão-Qingdao) moves above $32/tonne. The divergence narrows from the dry bulk side.
Second, container fleet supply discipline. If carriers respond to Q1 losses by aggressive blank sailings, scrapping older 8,000-12,000 TEU vessels, or slowing newbuild orders, container rates can stabilize. If carriers keep delivering capacity into a soft market, FBX continues to drift lower regardless of demand.
Third, geopolitical resolution. A genuine Hormuz reopening — written agreement, PGSA dismantled, Red Sea routes restored — would reset both markets simultaneously. Dry bulk rates would adjust through commodity flows. Container rates would adjust through routing economics. That convergence would temporarily look like the old correlation. It would be misleading. The underlying divergence would persist after the geopolitical reset cleared.
Implications
For shipowners and operators: portfolio diversification across dry bulk and container assets is less correlated than it used to be. The hedging argument for owning across segments has improved.
For charterers and shippers: don't extrapolate from one segment's freight trend to another. Container shippers should not assume that a falling BDI means container rates will fall. Bulk charterers should not assume that holding container rates implies firm raw-material demand.
For analysts: “shipping rates are up” or “shipping rates are down” is no longer a meaningful statement. Which segment matters.
Closing
For most of the last decade, the FBX and the BDI moved together often enough that the casual observer could treat shipping as a single market. That was always a simplification. In 2026, the simplification has stopped working.
Four indices. Four clocks. Each responding to its own demand drivers, supply constraints, and geopolitical pass-through. Each requiring its own analysis.
The two indices stopped moving together because the markets they measure stopped behaving the same way. That's not a temporary divergence. It's structure becoming visible.
Sources & References
- Maersk, Interim Report Q1 2026 (May 7, 2026) — Ocean segment EBIT, loaded freight rate, volume, and 2026 guidance
- Hapag-Lloyd, Quarterly Financial Report Q1 2026 (May 13, 2026) — Group EBIT, Liner Shipping segment results, freight rate per TEU
- Baltic Exchange — BDI, BCI, BPI, BSI daily assessments; BDTI and BCTI tanker benchmarks (2025-2026)