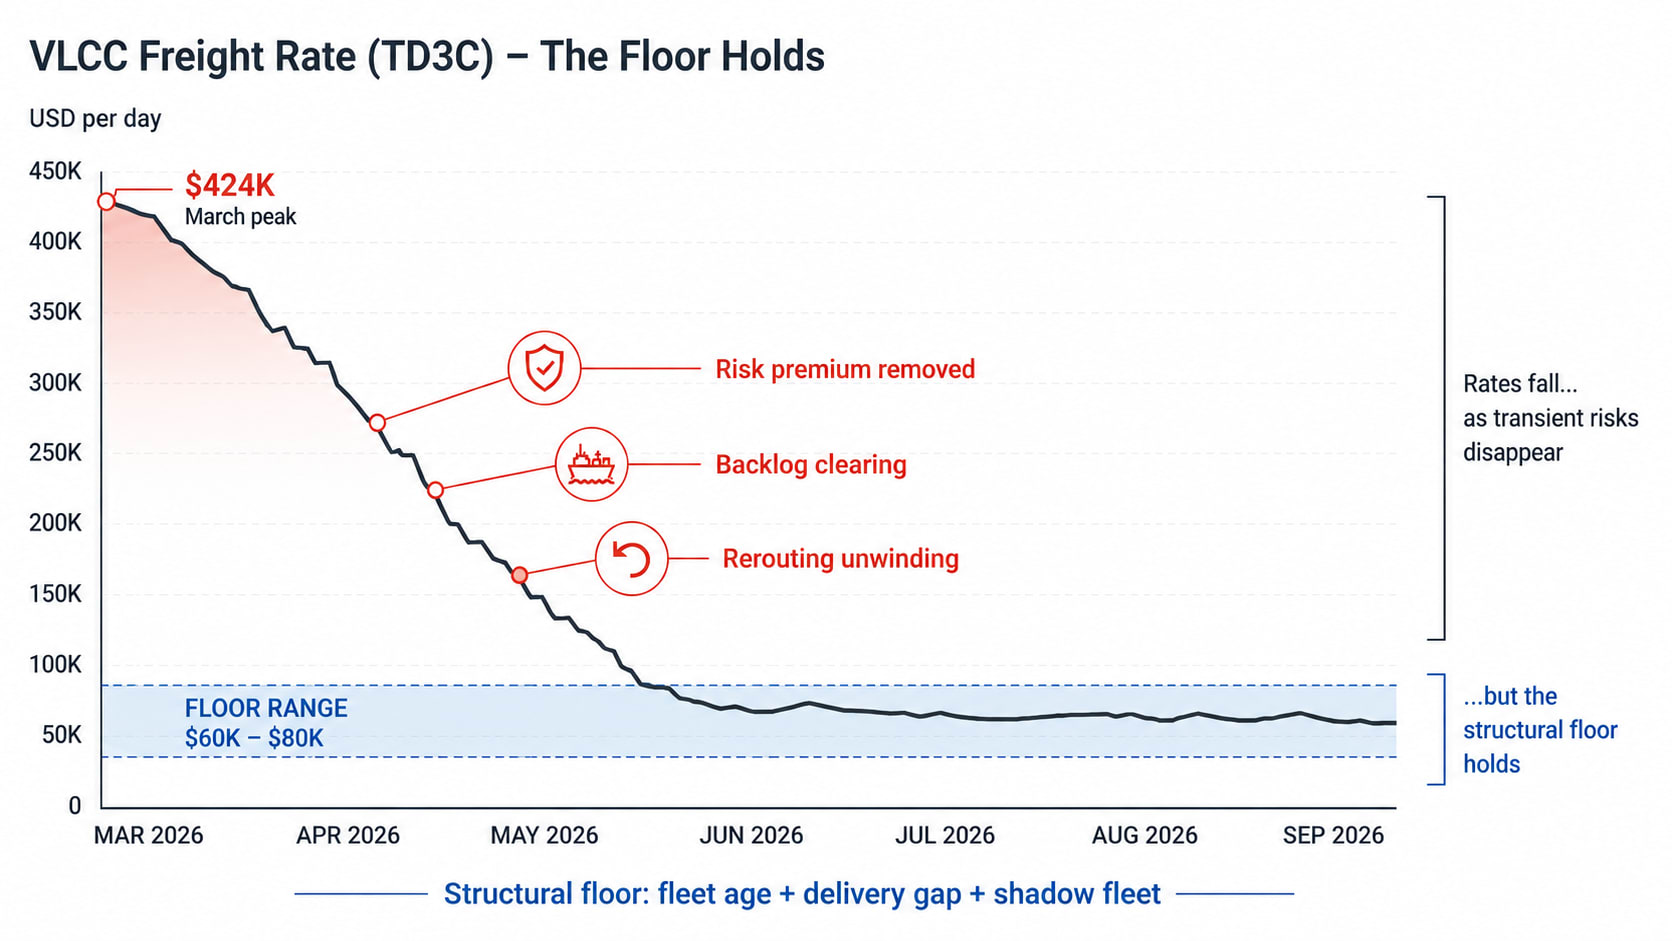
In March 2026, the TD3C — the benchmark VLCC freight index for the Middle East Gulf to China route — briefly touched $424,000 per day in TCE terms. It was the highest VLCC earnings figure ever recorded. The previous record, set during the 2008 oil crisis, was roughly $350,000.
Two records, eighteen years apart, driven by entirely different forces. 2008 was a demand-driven spike — oil at $147 per barrel, refiners scrambling for delivery. March 2026 was a chokepoint spike — the physical closure of the waterway that handles 21% of global crude. Different causes. Same outcome: a single vessel class setting all-time daily earnings records.
Since then, the situation has changed. Brent has retreated from $117 to $87. Negotiations have progressed. Transit volumes through the Strait have partially recovered. The market is pricing a reopening, or something close to it.
The question being asked across freight desks in June 2026 is not whether rates will fall. They will. The question is where they land — and what stops them from falling further.
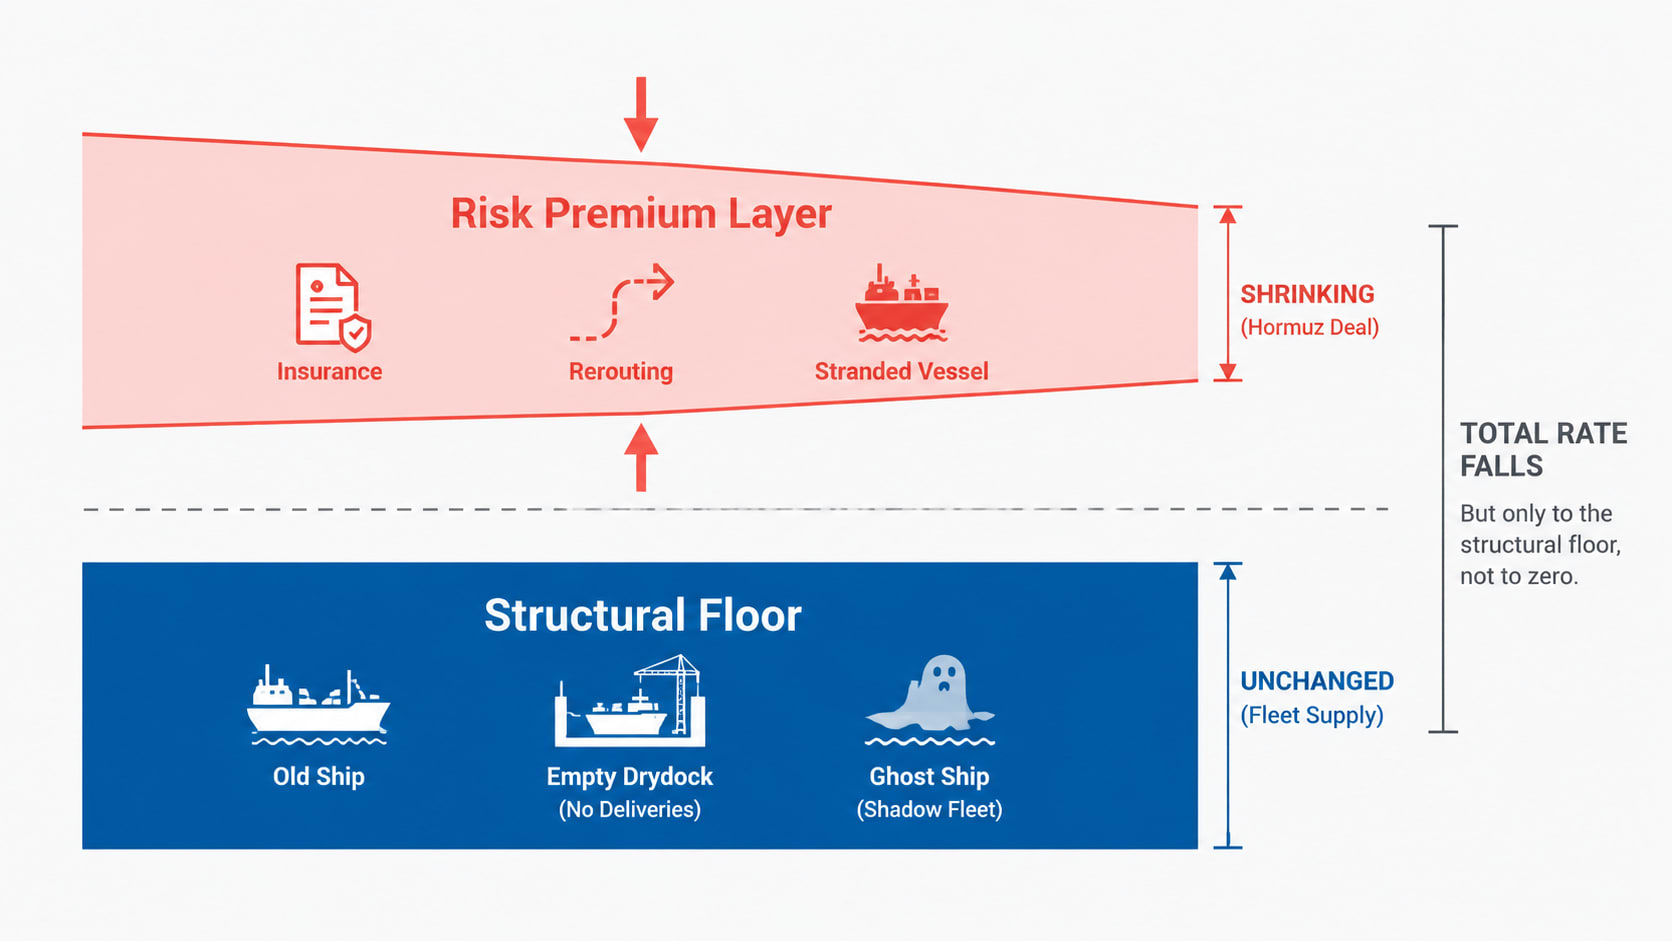
The answer requires separating the tanker rate into two distinct components. The first is the risk premium — the layer added by the Hormuz crisis, consisting of war risk insurance costs, rerouting penalties, and the supply reduction caused by 800 stranded vessels. This layer compresses when the Strait reopens. The second is the structural floor — the layer set by the fleet itself. This does not change with a peace agreement.
The Strait sets the spike. The fleet sets the floor.
§1 — The risk premium and its three channels
The Hormuz risk premium is not a single surcharge applied on top of the base rate. It is the aggregate of three separate cost mechanisms, each adding to the freight invoice through a different channel.
Channel 1 — War risk insurance. When the Joint Hull Committee reclassified the Strait of Hormuz as a war risk zone in early 2026, war risk premiums jumped from roughly 0.25% of hull value to 1–3%. For a VLCC with a hull value of $150 million, this translates to $1.5 million to $4.5 million per transit. That cost does not disappear between voyages — it is priced into every fixture agreed while the zone classification stands.
Channel 2 — Rerouting penalty. Vessels that avoided the Strait and rerouted via the Cape of Good Hope added thousands of nautical miles and approximately 10–14 additional sea days per round voyage. At the earnings rates prevailing in 2026, those extra days represent a significant opportunity cost. Charterers absorbing the rerouting cost paid it in freight — whether as a flat premium or as an adjusted voyage duration estimate.
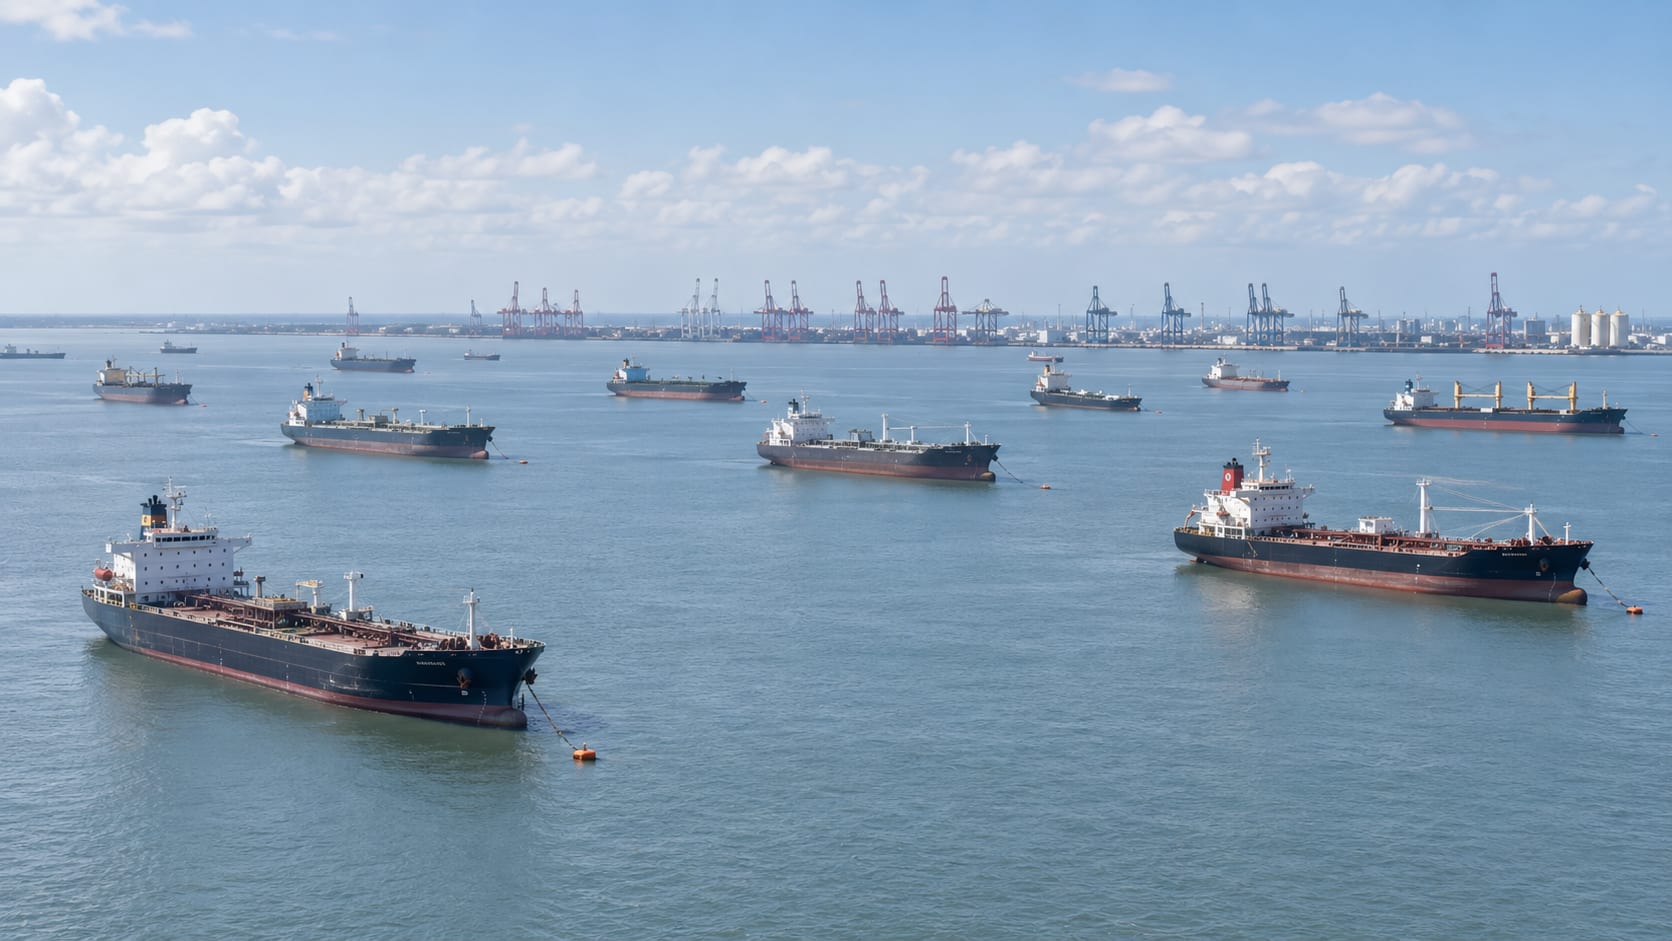
Channel 3 — Stranded tonnage. At the height of the crisis, more than 800 vessels of all types — tankers, bulkers, containers, LNG carriers — were reported stranded inside the Gulf, waiting for conditions to clear or permits to transit. Vessels anchored in the Gulf are not vessels available on the open market. When effective supply contracts, rates for available vessels rise. The 800-vessel backlog was not a Gulf problem. It was a global supply problem.
Three channels. One arithmetic. The risk premium is not a single surcharge — it is the sum of insurance, distance, and immobilised steel. Remove all three and the rate falls. The question is how far — and what stops it.
§2 — How fast the risk premium compresses
The speed of risk premium removal is not uniform. Each channel compresses on a different timeline.
War risk insurance responds within days of a credible zone reclassification by the Joint Hull Committee. The JHC reclassifies based on confirmed incident data and diplomatic signalling — not on a verbal ceasefire announcement. Once the Strait is declassified, the premium falls immediately on new policies and within weeks on renewal cycles. This is the fastest-compressing element of the three.
Rerouting penalties compress as soon as vessels return to standard routing. A tanker that was adding 10 days per voyage via the Cape recovers those days within its first post-reopening voyage cycle. For the broader market, routing normalisation takes 30–60 days — the time required for the active fleet to redistribute back to Gulf-origin voyages and for fixture books to be rebuilt on the original route assumption.
Stranded tonnage re-entry is the slowest channel. More than 800 vessels waiting in or near the Gulf do not re-enter global trades simultaneously. They transit in sequence as berth slots, permit windows, and cargo readiness align. Industry sources — including senior executives at major Gulf producers — have identified repositioning tankers as the single biggest operational obstacle to normalisation. The re-entry of this tonnage is not a supply surge. It is a supply restoration — absorbing demand that was being served by non-Gulf vessels at premium cost. But even a gradual restoration of 800 vessels to their normal trading lanes represents a meaningful increase in effective global supply over 30–90 days.
The net effect of all three channels compressing: VLCC rates on the TD3C route move from the March 2026 peak toward a significantly lower equilibrium. The risk premium layer disappears. What remains is the structural floor.
§3 — Three phases of normalisation
The normalisation does not happen in one move. It happens in three overlapping phases, each with a different rate equilibrium and a different mechanism driving it.
Phase 1 — Risk premium removal (0–30 days from reopening). War risk insurance premiums compress. Standard routing resumes. The risk surcharge embedded in spot fixtures unwinds. Rate range: $100,000–$150,000/day TCE on TD3C. This is the move the headline prices. Brent falls. TD3C falls. The rate chart shows a dramatic compression from peak.
Phase 2 — Backlog clearance (1–6 months). The 800+ stranded vessels re-enter global trades. Forward fixture books reset to pre-crisis routing assumptions. Period charter renewals price the new equilibrium rather than the crisis premium. Rate range: $80,000–$120,000/day. The headline has already moved, but the freight market is still absorbing the backlog. Spot rates remain volatile during this phase as repositioning creates temporary imbalances on individual trade lanes.
Phase 3 — Structural equilibrium (6–18 months). Based on the supply dynamics analysed in our VLCC Fleet Deep Dive — 1% effective supply growth against 2–3% demand growth, 200 VLCCs removed from the mainstream pool, and a delivery gap that does not close until 2028 — our estimate of the structural equilibrium sits in the range of $60,000–$80,000/day. This is a fairwayeta analytical estimate. It is not a market consensus figure.
For reference: the 2015–2020 VLCC average was $25,000–$30,000/day. The Phase 3 floor represents 2–3 times the old norm — not because the Strait is still relevant in Phase 3, but because the fleet has structurally changed.
Three phases. Three time horizons. Three different equilibria. The headline will price Phase 1. The freight market will settle on Phase 3.
§4 — What the structural floor is built on
The structural floor argument rests on four variables. All four exist independently of the Hormuz crisis. All four were present before March 2026. All four will remain after the last stranded vessel has repositioned.
Fleet age. As of mid-2026, 130 VLCCs are more than 20 years old. This is the highest proportion of aged tonnage in fleet history — five years ago the number was under 20. Vessels above 20 years face escalating maintenance costs, limited access to major charterers, and exclusion from an increasing number of terminal berths and port state control regimes. They are not retiring rapidly because scrapping rates are suppressed by low demolition steel prices and high replacement costs. They are still trading — but they are less reliable, slower to operate, and increasingly restricted in where they can trade.
Delivery gap. In 2024, one new VLCC was delivered worldwide. In 2025, five to six. The historical average is 35–40 per year. The global VLCC orderbook saw 52 new orders in 2024 — the largest annual total in years — led by Greek owners, but yard slots are booked through 2027 and into 2028, and the delivery pipeline does not begin to close the gap until late in the decade. Effective supply growth in 2024 and 2025 was negative. It remains below the long-run average in 2026 and 2027.
Shadow fleet exclusion. Approximately 200 VLCCs — roughly 23% of the global fleet — are outside the IG P&I system and unavailable to mainstream charterers. These vessels primarily serve sanctioned crude flows (Iranian, Russian, Venezuelan) and operate outside the commercial freight market that the TD3C and other benchmarks measure. They do not return to the mainstream pool after a Hormuz peace agreement. They remain structurally excluded. The commercially available fleet is accordingly smaller than the nominal headcount suggests.
Secondhand prices. A 10-year-old VLCC was transacting at approximately $117 million in mid-2026. The long-run median secondhand value for an equivalent vessel is around $48.68 million. The 2.4-times premium is the asset market's way of pricing a sustained rate environment. Asset prices are not sentiment. They are forward freight rates discounted into steel. When buyers pay 2.4-times median for a 10-year vessel, they are pricing in a structural floor — not a crisis premium.
§5 — What the secondhand premium is saying
The $117 million secondhand price is the single most important data point for the structural floor argument — because it is set by buyers who lose money if they are wrong.
A buyer paying $117 million for a 10-year VLCC needs to recover that capital over the vessel's remaining commercial life. At a cash breakeven of roughly $35,000–$40,000/day (including financing), the vessel generates positive cash flow as long as the market stays above that level. At $60,000–$80,000/day structural rates, the investment makes sense. At $25,000–$30,000/day (the 2015–2020 average), the buyer is underwater.
The buyers paying $117 million for 10-year VLCCs in 2025 and early 2026 — Greek owners, Norwegian investors, commodity traders building captive fleets — are making an explicit bet that the floor does not return to its pre-2021 level. They are pricing the same four structural variables described above. The secondhand premium is not irrational exuberance. It is a statement about supply scarcity that the buyers are prepared to back with capital.
Frontline, which entered Q2 2026 with 82% of VLCC days booked at $181,700/day average TCE, operates at a cash breakeven of approximately $28,000/day. At Phase 3 rates of $60,000–$80,000/day, they continue to generate significant free cash flow. At the 2015–2020 average of $25,000–$30,000/day, their financial position changes materially. The secondhand market is not pricing a return to $25,000.
§6 — The floor that remains
The paradox of the Hormuz reopening is that the crisis itself obscures the floor it will reveal. When TD3C is at $424,000/day, the conversation is about war and chokepoints. When it compresses to $100,000 and then $80,000, the conversation will shift — and many participants will interpret the compression as a signal to exit the trade, short the asset market, or reduce exposure.
They will be pricing the wrong layer.
The risk premium layer is the visible one. It spiked dramatically, it is compressing visibly, and it will continue to compress. The structural floor is the invisible one. It was there before March 2026. It is there now. It will be there after the last stranded vessel has cleared the Gulf.
The floor rests on four pillars: 130 VLCCs over 20 years old; a delivery gap that does not close until 2028; 200 VLCCs structurally excluded from the mainstream pool; and secondhand asset prices that are 2.4 times the long-run median. None of these change with a peace agreement. The floor is set by steel, not by diplomacy.
The implication for voyage planning and fixture pricing in Q3 2026 is straightforward: when the headlines report that VLCC rates have fallen from $424,000 to $80,000, the appropriate response is not to assume the correction has run its course. It is to check whether $80,000 is above or below the structural floor.
Based on our analysis, it is approximately at the floor — not below it. The risk premium will have fully compressed. The structural constraint will have fully asserted itself. What you are looking at at $80,000 is not a depressed market. It is the market pricing the actual cost of moving a VLCC in a world where 130 vessels are ageing out, 200 are structurally excluded, and the replacement pipeline is two years behind.
The Strait reopens. The rate falls. But not to where it was.
- EIA, Middle East crude oil tanker rates (March 2026)
- Baltic Exchange tanker route assessments (2025-2026)
- Frontline plc SEC filings (Q4 2025, Q1 2026)