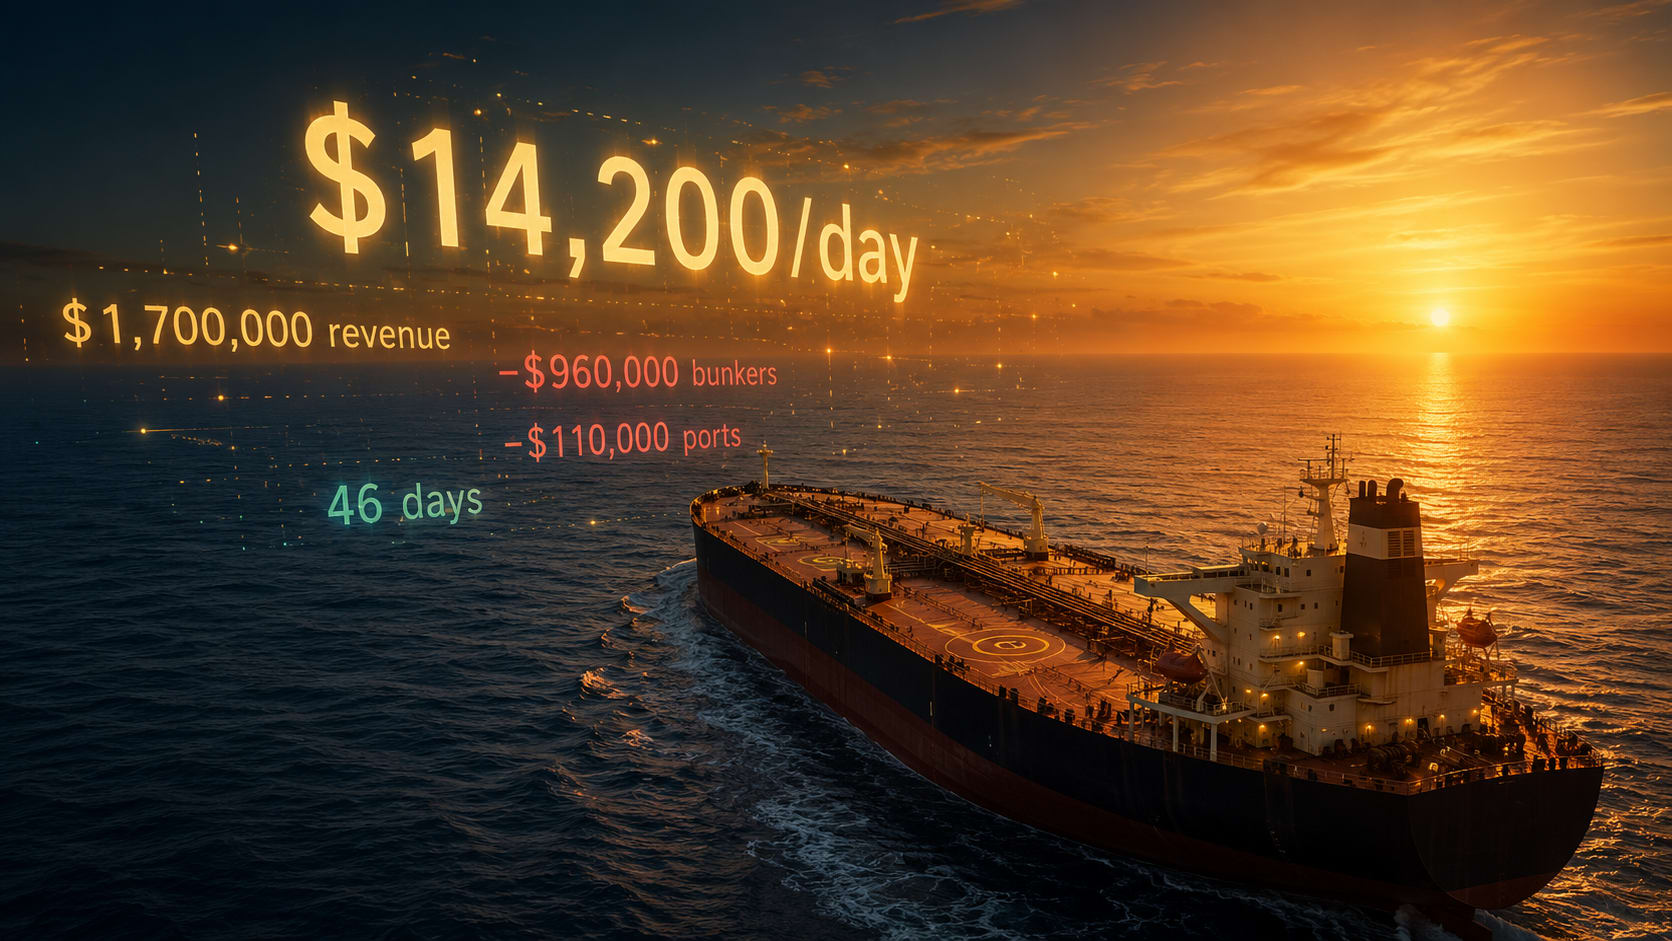
A VLCC earns $1.7 million in freight revenue on a single voyage from the Middle East Gulf to China.
That number sounds large. It tells you almost nothing about whether the voyage was profitable.
The voyage burned $680,000 in bunker fuel. Port charges at both ends added another $230,000. The Strait of Hormuz passage fee came to $85,000. Canal dues, agency fees, and miscellaneous port costs rounded the total voyage expenses to roughly $1.05 million. The voyage took 42 days. Strip out costs, divide by days, and the ship netted $650,000 — which works out to $15,500 per day.
That $15,500/day is the Time Charter Equivalent. It is the number that matters. And it is barely above the fleet average operating cost for an older VLCC.
The TCE conversion exists because shipping is not a business where revenue alone conveys anything useful. A ship that earns $2.4 million on a 90-day voyage and a ship that earns $1.7 million on a 42-day voyage are not directly comparable without reducing both to a daily rate. The TCE does that reduction. Every voyage, regardless of route length or cargo size, becomes a single comparable number: dollars per ship-day.
Why the freight line on a fixture lies
Shipping has a transparency problem. The headline number on a charter fixture — the gross freight — looks like revenue but behaves nothing like it. A fixture agreed at WS 150 on a Middle East Gulf to China voyage produces a completely different net daily return than WS 150 on a Middle East Gulf to Rotterdam voyage, because the underlying flat rates are different and the voyage costs are radically different. Without the TCE conversion, comparing the two numbers is meaningless.
The same issue applies across time. A VLCC earning WS 140 in 2024 and a VLCC earning WS 140 in 2026 may produce different TCEs because bunker prices have shifted — and bunker is priced into the voyage cost calculation, not the WS flat rate. The Worldscale table is recalibrated once a year; bunker prices move daily. In a year where VLSFO moves from $600/MT to $800/MT between January and June, a fixture at WS 140 in June yields a meaningfully lower TCE than the same WS number produced six months earlier.
The TCE calculation solves both problems. It converts every fixture — regardless of route, vessel size, WS level, or bunker price — into a single daily rate that can be stacked against any other.
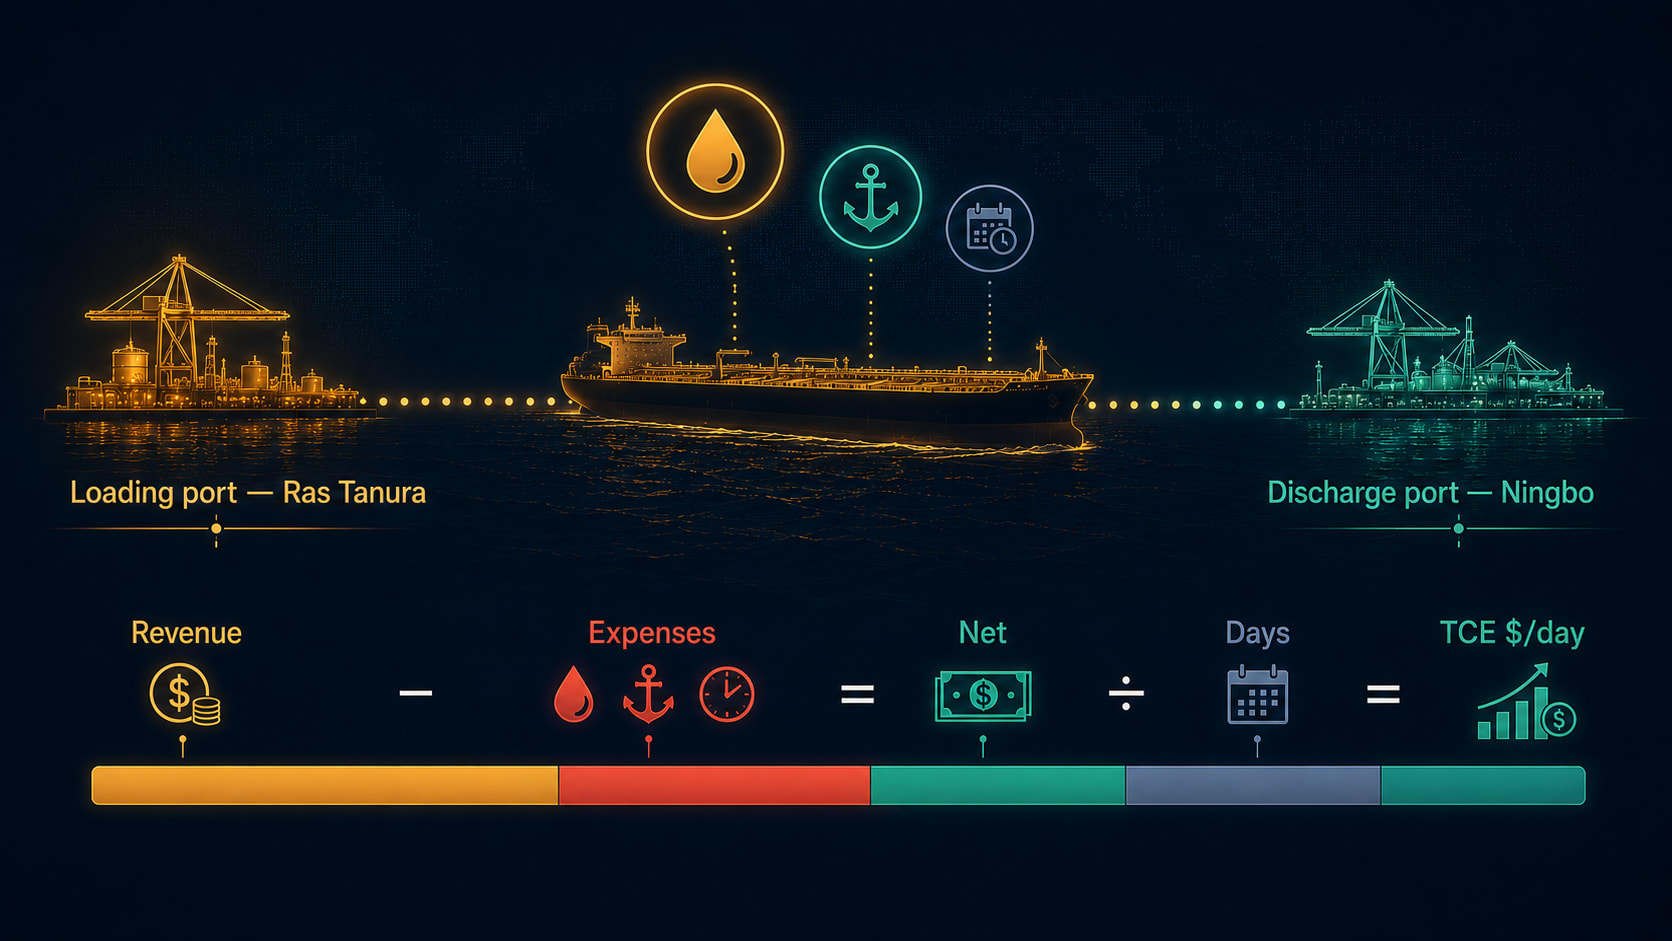
The worked example — TD3C, Ras Tanura to Chiba
The Baltic Exchange's benchmark VLCC route for crude oil is TD3C: Ras Tanura (Saudi Arabia) to Chiba (Japan), loading 270,000 metric tonnes. It is one of the highest-volume trades in the crude market — Saudi crude flowing into Japan's refinery complex — and the Baltic's daily assessment of this route is one of the most quoted numbers in tanker shipping.
The voyage is roughly 6,600 nautical miles. At standard speed, laden passage takes approximately 19 days. Add ballast return (roughly 16 days back to a loading area in the Gulf), port time at both ends, and the round voyage runs about 42 days. With VLSFO at $771/MT (as of June 2026), a VLCC consuming 62 tonnes per day underway burns approximately 2,300 tonnes of fuel on the laden leg alone — a bunker bill approaching $1.8 million per round voyage before port costs.
Here is what happens to the daily TCE as the WS rate changes on this route:
The loss at WS 60 is not hypothetical. During the 2023 tanker market trough, VLCC spot rates briefly touched those levels as a supply flush moved through the market. At WS 60 on TD3C, a modern VLCC earns below its daily cash operating cost — the ship loses money on a cash basis for every day it is on the water.
At WS 100, the ship is marginally profitable but barely. At WS 150, the daily return is meaningful but still below the kind of free cash flow that justifies new capital investment. At WS 200, the ship is solidly in the money. At WS 280 — the level that characterised Q4 2025 and parts of Q1 2026 — the daily TCE approaches territory that was considered unrealistic before 2022.
At WS 200, TCE rises to roughly $72,000/day — now solidly above the historical average. At WS 280 — the kind of rate seen in the Q4 2025 and early 2026 spikes — TCE approaches $130,000-150,000/day.
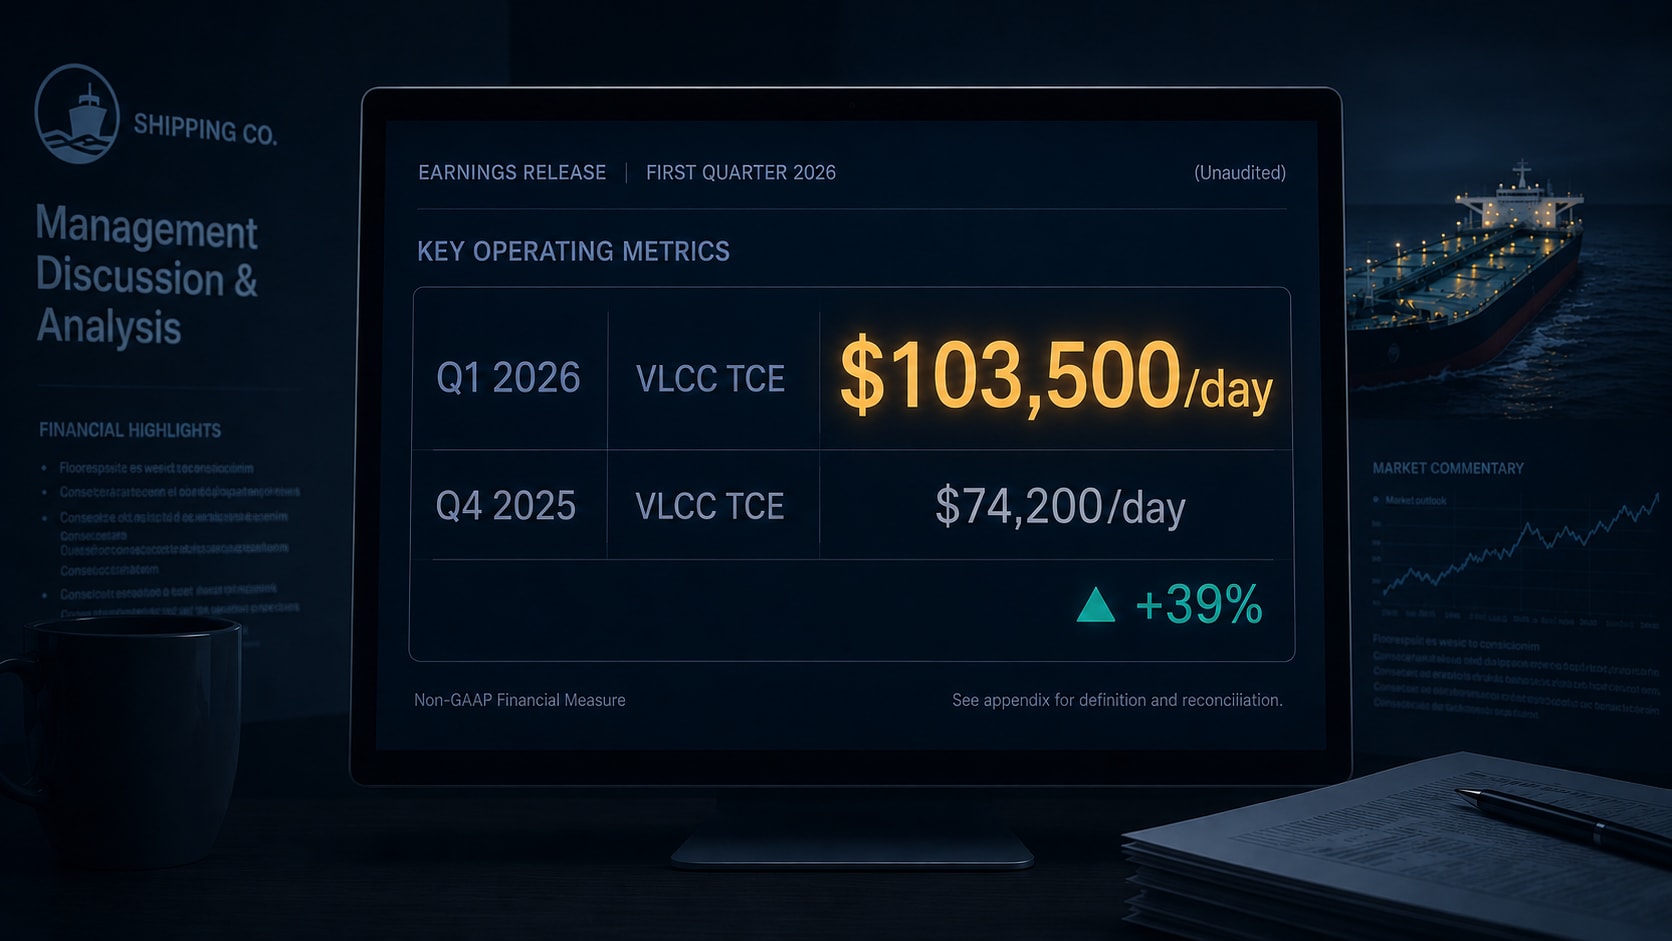
These are not hypothetical numbers. Frontline reported Q1 2026 actual VLCC TCE of $103,500/day, with Q2 2026 bookings at $181,700/day on 82% of available vessel days. The WS-to-TCE conversion at these levels produces six-figure daily earnings that were considered impossible five years ago.
The four dials that move the number
The TCE formula reduces to a simple expression: net voyage revenue divided by voyage days. But inside that expression are four inputs that have compounding effects on the outcome.
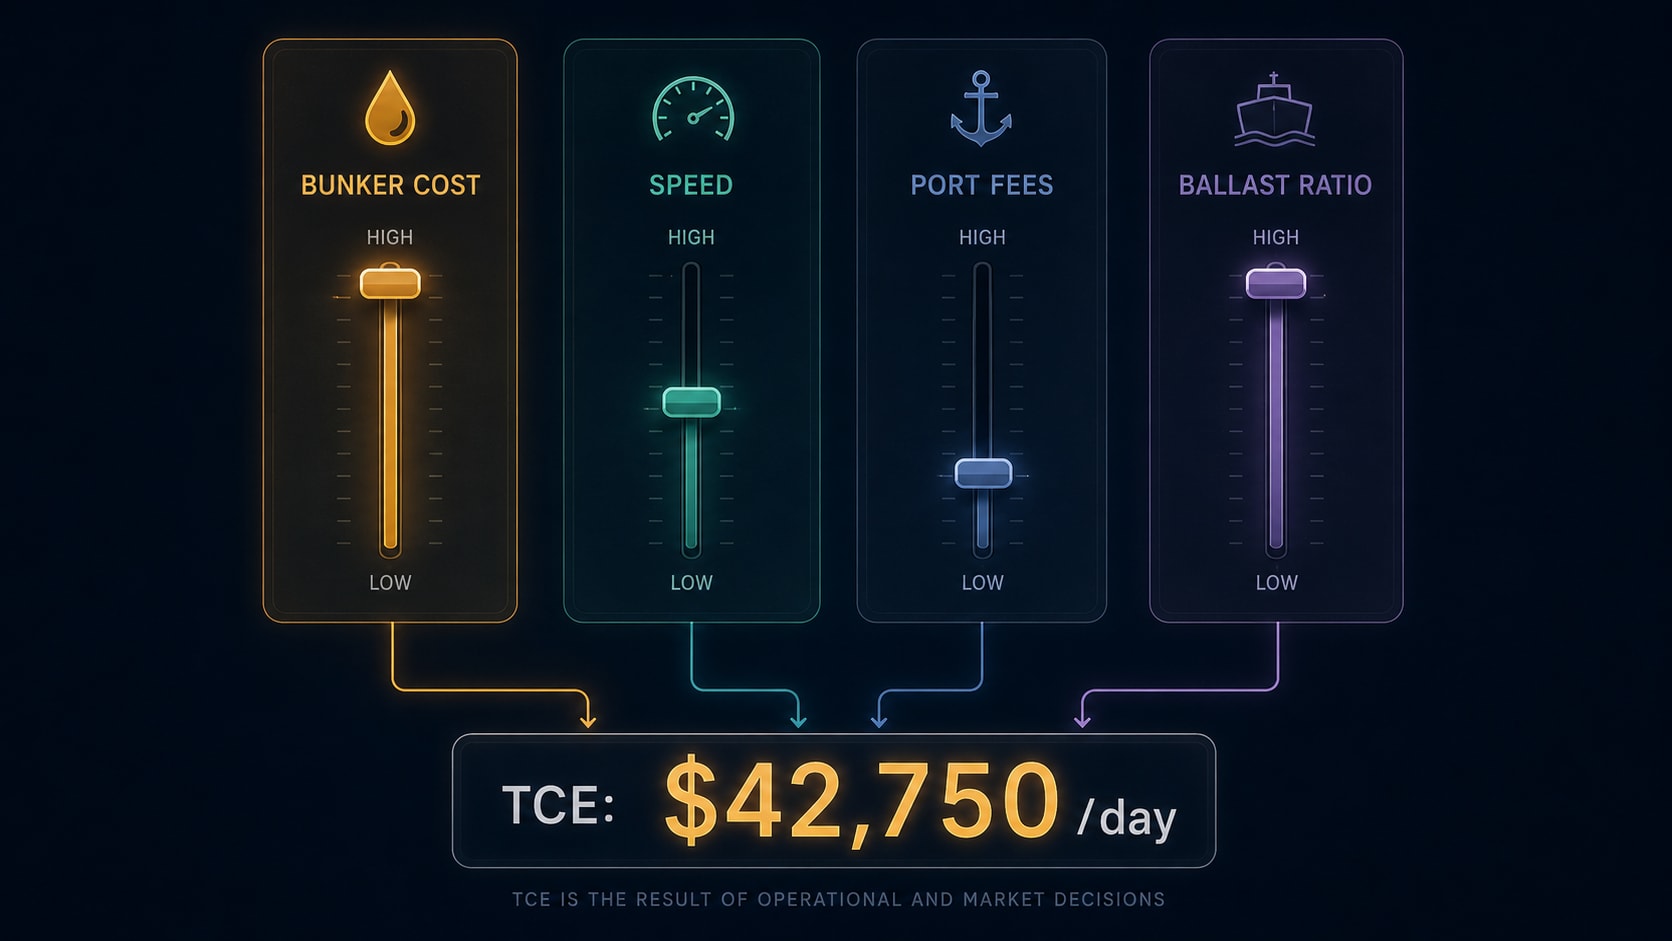
Bunker fuel is the dominant cost on any ocean voyage. For a VLCC, fuel typically represents 40 to 60 percent of total voyage costs. At $771/MT (as of June 2026), VLSFO for a full round voyage from the Gulf to East Asia runs $1.5 million or more. A $200/MT swing in bunker prices — which the market produced in both 2022 and 2024 — translates directly into a $1 million shift in voyage cost, or roughly $24,000 per day on a 42-day round voyage. No other input moves the TCE number this far.
Speed is a dial that owners can actually turn. Slowing a VLCC from 14.5 knots to 12 knots reduces fuel consumption by approximately 30 percent — a cubic relationship between speed and fuel burn. But it adds roughly five days to the laden passage. The net effect on TCE is not automatic: you save on fuel, but you spread fixed costs over a longer period and reduce the number of voyages completable per year. Slow steaming is a calculated trade-off, not a free saving.
Port fees are fixed costs that do not scale with the WS rate. A Suez Canal transit for a VLCC costs $400,000 to $600,000 per crossing regardless of whether the ship is earning WS 80 or WS 280. Some owners on the Middle East Gulf to Europe run have shifted to Cape routings when the canal toll exceeds the value of the time saving. The economics of that decision depend directly on the current WS rate: at WS 80, paying $500,000 for a five-day shortcut makes no sense. At WS 280, it might.
Ballast days are the invisible cost that the Worldscale rate does not capture at all. TD3C quotes a one-way rate from Ras Tanura to Chiba. But the ship has to get to Ras Tanura first — sailing empty from a previous discharge port. Those 15 to 20 ballast days burn fuel at normal rates and generate zero revenue. The TCE calculation absorbs them into the denominator, which is why the round-voyage TCE is always lower than the simple one-way arithmetic would suggest.
TCE across vessel classes
The TCE concept applies to every tanker segment, but the absolute dollar levels are not comparable across classes. A Suezmax earning $40,000/day on a West Africa to Europe run is doing well for a Suezmax. A VLCC earning $40,000/day in the current market is running below its long-run average.
The structure of voyage costs scales roughly with vessel size, but not linearly. A VLCC burns about three times the fuel of an Aframax per day, but it carries four to five times the cargo per voyage. The result is that VLCC economics are inherently more leveraged: at high WS rates, the TCE is dramatically higher; at low WS rates, the absolute loss per day is also larger. This asymmetry is one reason VLCC owners are structurally more sensitive to market cycles than smaller tanker operators.
The Baltic Exchange maintains separate TCE benchmarks for each segment: TD3C for VLCC crude, TD20 for Suezmax West Africa to Europe, TC5 for Aframax Baltic clean product routes. Cross-segment comparison is possible within the TCE framework, but it requires knowing the context: what is the prevailing rate for that size class, what are the current operating expense levels, and what is the owner's capital structure.
Who uses TCE — and how they report it
TCE is the language in which tanker companies communicate with investors, analysts, brokers, and counterparties. Every major publicly listed tanker owner — Frontline, CMB.TECH (formerly Euronav), International Seaways, DHT, Teekay Tankers, Scorpio Tankers — reports quarterly results in TCE per vessel-day. It is the metric used in SEC filings, earnings calls, and fleet reports.
The use of TCE in financial reporting serves a specific purpose: it strips out the charter party structure and presents a vessel's earnings on a basis directly comparable between companies and quarters. A Frontline result of $103,500/day can be compared to an International Seaways result in the same quarter because both report the same metric against the same denominator — available vessel-days.
Brokers and fixture platforms — Clarkson, Gibson, BRS — publish TCE estimates alongside WS fixtures as a service to the market. The estimate uses publicly available bunker prices and route-specific cost assumptions to convert the headline WS quote into a daily earnings figure. These estimates are not exact — the actual voyage cost depends on the specific vessel, its fuel efficiency, and the port charges incurred — but they give the market a directional read.
The Baltic Exchange BDTI (Baltic Dirty Tanker Index) and BCTI (Baltic Clean Tanker Index) compress WS assessments from multiple routes into single daily indices. Analysts generally watch the underlying TCE estimates more closely than the BDTI/BCTI headlines, because the indices aggregate routes with different cost structures.
What counts as a good TCE — and why the old benchmarks no longer apply
A few practical anchors for context.
VLCC daily operating expenses run roughly $7,600-12,000/day depending on fleet age and management efficiency — Frontline reported $7,600/day in Q4 2025. Below that TCE, the ship loses money on a cash basis.
The historical context has shifted decisively. Through 2015-2020, VLCC TCE averaged $25,000-30,000/day, and sustained periods above $80,000 were rare. The 2022-2026 environment is structurally different.
Frontline — the largest publicly listed VLCC owner — reported Q4 2025 VLCC spot TCE of $74,200/day. Q1 2026 came in at $103,500/day. For Q2 2026, 82% of VLCC vessel days were booked at $181,700/day — a figure that would have been unthinkable two years earlier.
Frontline's cash breakeven sits at $24,300/day. At Q2 2026 booking rates, the company generates roughly $157,000 per ship per day above breakeven.
Whether this represents a structural shift — driven by shadow fleet absorption, ageing fleet supply constraints, and tonne-mile demand growth — or a multi-year cycle peak before reversion is the central question of the current tanker market. What is clear is that the old benchmarks no longer apply. Six-figure daily TCE is the prevailing environment, not the exception.
The TCE is not just a number. It is the lens through which every participant in the tanker market — owner, charterer, analyst, investor — reads the same data and arrives at the same daily earnings figure. A WS fixture without the TCE calculation is a headline without a story. The TCE is the story.
For more on how WS rates are calculated and why the same WS number means different dollars on different routes, see What Is Worldscale?. The contract structures that determine whether a voyage or time charter is more appropriate are covered in Charter Parties Explained. For context on VLCC fleet earnings capacity, fleet age, and the supply constraints shaping current rates, see the VLCC Fleet Deep Dive. Vessel class definitions — why a VLCC earns differently from a Suezmax or Aframax on the same route — are explained in Tanker Sizes Explained.