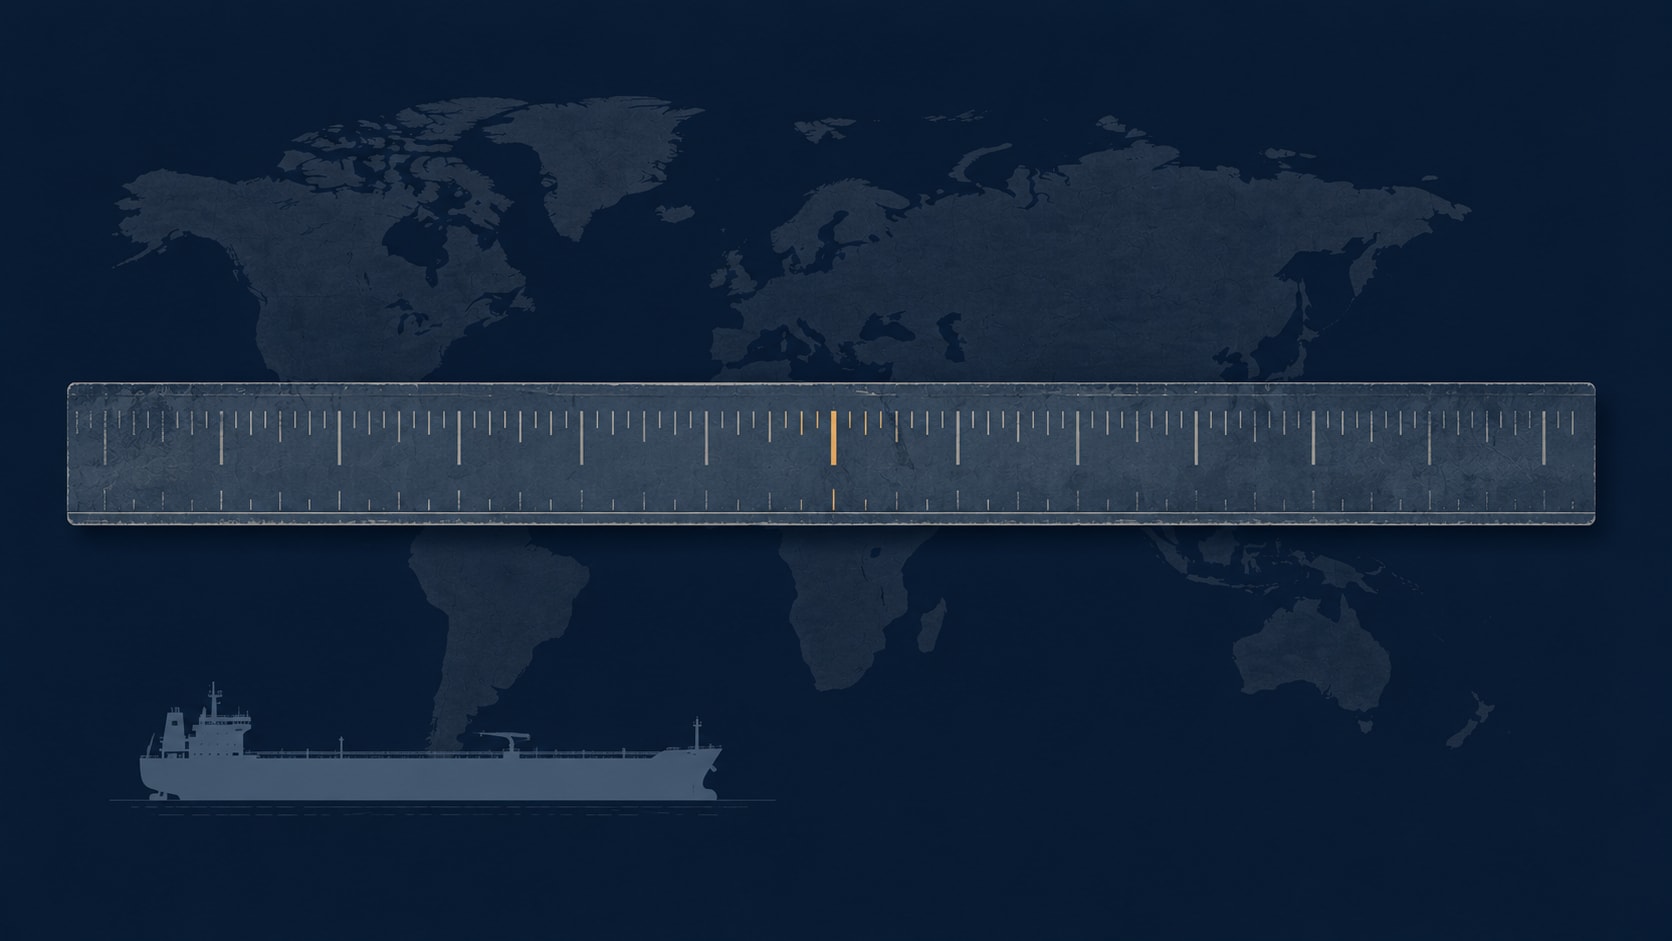
In the world of dry bulk shipping, freight rates are quoted in dollars per tonne. A Capesize fixture for iron ore from Brazil to China might be done at $32 per tonne, and that number means exactly what it says: thirty-two dollars for each tonne of cargo carried.
In the world of tanker shipping, freight rates are quoted in a unit called Worldscale, abbreviated WS. A VLCC chartered from the Middle East Gulf to Japan might be fixed at WS 80 one week and WS 280 the next.
That second number, WS 280, looks like a 250% increase from the first. It isn't, exactly. The number doesn't mean what it seems to mean. WS 100 isn't a hundred dollars. WS 280 isn't "two hundred and eighty" of anything you can directly measure on a single voyage. And the same WS 280 quote can be profoundly profitable on one route and barely break-even on another.
The Worldscale system is one of the more idiosyncratic pricing conventions in any global commodity market. It was built in the early 1950s to solve a specific problem, and more than seventy years later, the industry has stuck with it because the alternatives are worse. It is worth understanding what it actually measures.
Let's walk through it the way a tanker chartering desk actually reads it.
What Worldscale actually is
Worldscale, formally the "Worldwide Tanker Nominal Freight Scale," is a reference table. It is not a price. It is not a market. It is a list of theoretical baseline costs for shipping crude oil and petroleum products across roughly 300,000 different voyage combinations around the world.
The table is published once a year, with revised rates taking effect each 1 January (typically released in late autumn of the previous year). It is produced by two non-profit bodies: the Worldscale Association (London) Limited and the Worldscale Association (NYC) Inc. Each one is governed by a panel of senior tanker brokers, and they coordinate to maintain a single global table that everyone in the tanker market uses.
The system was created in November 1952. Two oil companies, British Petroleum and Shell, asked the London Tanker Brokers' Panel to develop a standardized way to quote tanker freight, because the existing patchwork of regional rate sheets was making negotiations slow and inconsistent. Multiple regional schedules — Scale No. 1, 2, and 3 in London (from 1952 onwards), evolving into Intascale by the 1960s, alongside ATRS (American Tanker Rate Schedule) in New York — operated in parallel until they were merged into the unified Worldscale system in 1969. The modern Worldwide Tanker Nominal Freight Scale publication, in essentially its current form, took effect on 1 January 1989 and has been revised annually ever since.
The underlying problem the system was designed to solve has not changed. Tanker cargoes are often sold and resold while the ship is still at sea. The vessel might load at one port and end up discharging at a port that wasn't specified at the time the charter was signed. A pricing convention that ties freight to one specific load-discharge pair would not survive that flexibility. Worldscale handles it by giving every plausible combination of load port and discharge port a pre-calculated baseline, and then expressing the actual negotiated rate as a percentage of that baseline.
That percentage is the WS number.
How the flat rate is calculated
The Worldscale flat rate — the number that gets called WS 100 — represents the freight rate, in US dollars per metric tonne of cargo, that a standard reference tanker would need to charge on a specific voyage to earn a defined daily return after expenses.
The "standard reference tanker" is fictional. The Worldscale Associations specify a single notional vessel profile: a 75,000-deadweight-tonne tanker — roughly Aframax-class — with defined fuel consumption (around 55 tonnes of fuel oil per day at sea, 5 tonnes per day in port), service speed of 14.5 knots, and standard port time allowances. Every voyage in the table is priced as if this one ship is doing the run.
The calculation takes the standard ship and works through the voyage:
- The distance from load port to discharge port, and back (the return is normally in ballast — empty)
- Bunker fuel consumption at the standard speed
- Current bunker prices at representative ports
- Standard port charges at each end
- Canal dues (Suez, Panama) where applicable
- A fixed daily hire amount that the ship is assumed to need to break even
Add it all up, divide by the cargo tonnage, and the result is a dollar-per-tonne number. That number is the WS 100 flat rate for that specific voyage.
Worldscale 100 from Ras Tanura (Saudi Arabia) to Chiba (Japan) — the TD3C benchmark route — is published at around $19 per tonne for 2026 (rounded from the Worldscale Association schedule). Worldscale 100 from Ras Tanura to Rotterdam — a much longer voyage — comes out at around $28 per tonne.
Both are "WS 100" in the table. But the underlying dollar values are completely different, because the voyages are completely different. The WS number normalizes the difference.
The table is updated once a year. Between updates, bunker prices move, port costs move, currencies move — but the WS 100 flat rates don't. That is the whole point: the reference is supposed to stay still so the market can move around it. Think of Worldscale as a measuring stick that has been on every tanker broker's desk since the mid-twentieth century. The stick itself doesn't change much from year to year. What changes is the market: how many of those notional units a real fixture is actually worth on any given week.
What WS 100, WS 50, and WS 280 actually mean
Here is where the system gets its name from. The actual freight rate negotiated for a specific fixture is quoted as a percentage of the WS 100 flat rate.
WS 100 means the negotiated rate equals the published flat rate exactly. The owner is, in theory, earning the standard daily return that the table was calibrated to.
WS 50 means the rate is half the flat. The owner is earning significantly less than the standard daily return.
WS 200 means the rate is double the flat. The owner is earning significantly more than the standard daily return — a strong tanker market.
WS 280 means the rate is 2.8 times the flat. The owner is in what tanker brokers call a "spike" market — usually driven by acute supply tightness, geopolitical disruption, or seasonal demand peaks.
The range quoted in practice runs from about WS 30 in deeply depressed markets (where some owners accept rates below break-even to keep ships employed) to over WS 400 in genuinely tight markets. The historical extremes have been wider — the 2020 oil price collapse saw VLCC rates spike above WS 200 as cargo owners scrambled to use tankers as floating storage. In March 2026, the Hormuz crisis pushed the TD3C benchmark above WS 400 — briefly exceeding WS 600 on some assessments — before normalising as the strait reopened. The historical range is wider than it appears.
The crucial thing to remember is that WS 280 on a Middle-East-to-Japan voyage and WS 280 on a Middle-East-to-Europe voyage represent two completely different dollar values per tonne — because the underlying WS 100 flat rates were different to begin with. Two voyages quoted at the same WS number can produce two completely different daily returns for the shipowner.
Why the system doesn't just use dollars
A reasonable question, and one that comes up often.
The tanker market deals in voyage charters where the load port, discharge port, vessel size, vessel age, and timing all vary enormously. A direct dollar-per-tonne quote without a reference framework would force every counterparty to calculate, from scratch, what that number means for their specific situation.
Worldscale solves this by providing a shared baseline. When two brokers quote WS 220, they both know exactly what dollar value that translates to for the specific voyage being discussed, because the table is the same on both screens. Negotiations move faster. Market levels can be discussed in terms of percentages, which compress better in conversation. "VLCC rates are at WS 250 this week" is a sentence that means something specific to anyone in the tanker market. "VLCC rates are at $32 per tonne this week" would not, because the dollar value depends on which route you're talking about.
The percentage framing also matches the way the market actually behaves. When tanker demand spikes, rates across multiple routes move together — not by the same dollar amount, but by roughly the same percentage. A 40% jump on one route tends to correspond to roughly a 40% jump on another route, because both are responding to the same underlying supply-demand pressure. Quoting in percentages makes that pattern visible. Quoting in dollars would hide it.
There is also a historical accident at work. The system was built in an era when oil companies wanted to compare shipping costs across many routes simultaneously, and they needed a single number that could be compared like-for-like. The Worldscale percentage was the answer in 1952. Nothing has replaced it because nothing has needed to.
What WS numbers don't tell you
Three things the headline WS number does not directly show.
Bunker prices have moved since January. The flat rate was calibrated using a 12-month average of bunker prices — from October of the previous year through September of the current year — along with representative port charges and canal dues at the time of publication. If bunker prices have risen significantly since then, the WS 100 rate is now under-compensating for fuel. A market quoting WS 200 might actually deliver less return to the owner than a WS 180 quote would have when the table was first published. Tanker desks know this and adjust mentally; outsiders reading the WS number alone often don't.
The standard ship is fictional. A real fixture might use a VLCC three times the size of the reference vessel, or an Aframax half the size. The economics of carrying 270,000 tonnes are not the same as 75,000 tonnes. The WS number gives a comparable percentage, but the actual breakeven for the specific vessel doing the voyage may differ substantially.
Port congestion, weather, and demurrage are not in the flat rate. Worldscale assumes a standard port turnaround time and standard voyage conditions. If the actual voyage involves a long queue at the discharge port, or storm diversions, or extended demurrage at load, the owner's effective return on a "WS 280" fixture might be well below what the percentage implies.
This is why tanker analysts always look at multiple indicators alongside the headline WS number. The most important is TCE (Time Charter Equivalent) — the daily dollar earnings the ship actually nets after fuel, port, and canal costs, calculated by working backwards from the WS rate. TCE is the number tanker desks actually watch when they want to know what a fixture genuinely earns. The Baltic Exchange publishes two daily indices based on WS quotes — BDTI (Baltic Dirty Tanker Index, for crude) and BCTI (Baltic Clean Tanker Index, for products) — which compress WS rates across major routes into a single market benchmark.
Reading the tape
For anyone trying to follow tanker markets without working on a chartering desk, three things are worth watching.
The spread between routes. When the WS rate on a Middle-East-to-China voyage moves sharply while the WS rate on a Middle-East-to-Europe voyage stays flat, something specific is happening to the eastbound trade — a Chinese inventory build, a refining run change, a specific arbitrage opening. When both move together, the underlying signal is broader (tanker supply tightening, oil demand changing in aggregate).
The relationship between spot and time-charter rates. Tanker rates can also be quoted as daily hire rates ($/day for a specific duration — six months, one year, three years). The relationship between the spot WS rate and the time-charter rate tells you whether the market thinks current tightness is short-term or structural. When time-charter rates rise faster than spot WS rates, the market is pricing in sustained tightness. When spot rates rise but time-charter rates stay flat, the market thinks the spike will fade.
The bunker gap. VLSFO and HSFO prices feed directly into the actual economics of a tanker voyage, but only get re-incorporated into the Worldscale table once a year. The wider the gap between current bunker prices and the bunker assumption used in the most recent flat rate calculation, the more the WS number is misleading you about real earnings. In years where bunker prices swing hard, tanker analysts use the published WS number as a rough indicator and a calculator alongside it for the real numbers.
The system has also begun to adapt to newer pressures. EU emissions costs under the EU ETS — now covering 50% of international voyage emissions and 100% of intra-EU and in-port emissions under the fully phased-in 2026 surrender obligation — are increasingly incorporated into charter party clauses that reference Worldscale-based fixtures, a quiet acknowledgement that the calibration logic of 1952 now has to handle carbon as well as fuel.
The 1952 system has survived this long because, even with all its limitations, it is still the cleanest available shorthand for a market that needs to negotiate thousands of voyages a year across hundreds of route pairs. The broker who quotes WS 240 to an oil major and the analyst who reads it the next morning are using a tool built before either of them was born — and they both know exactly what it means.
For more on the tanker market and the indices that sit alongside Worldscale, see our companion pieces on Tanker Sizes Explained, What the Baltic Dry Index Tells You, and Brent, WTI, Dubai — Three Oil Prices Explained.