Somewhere in London, a Capesize shipowner and a steel trader are agreeing on a freight rate for a route neither of them will actually use next quarter. No ship is being fixed. No cargo is being moved. But money will change hands — and the amount will be determined by the Baltic Exchange.
This is a Forward Freight Agreement. It is the freight market's version of what oil markets do with futures and currency desks do with forwards: it lets two parties fix a price today for something that will happen — or be measured — in the future. The FFA market today trades billions of dollars in notional value every month — dry bulk freight futures alone average over 12,000 lots per trading day, with tanker and container derivatives adding further volume.
The BDI you read in the news is yesterday's rate. The FFA is tomorrow's. This piece explains how the two connect — and what the gap between them tells operators, charterers, and analysts about where the market thinks freight is going.
What an FFA actually is
An FFA is a cash-settled financial contract between two parties — typically a buyer and a seller — referencing a specific shipping route over a specific time period. The contract specifies four things: the route, the period, the agreed rate, and the quantity (measured in lots, where one lot equals one day of hire on one vessel).
Four terms. One contract. No ship required.
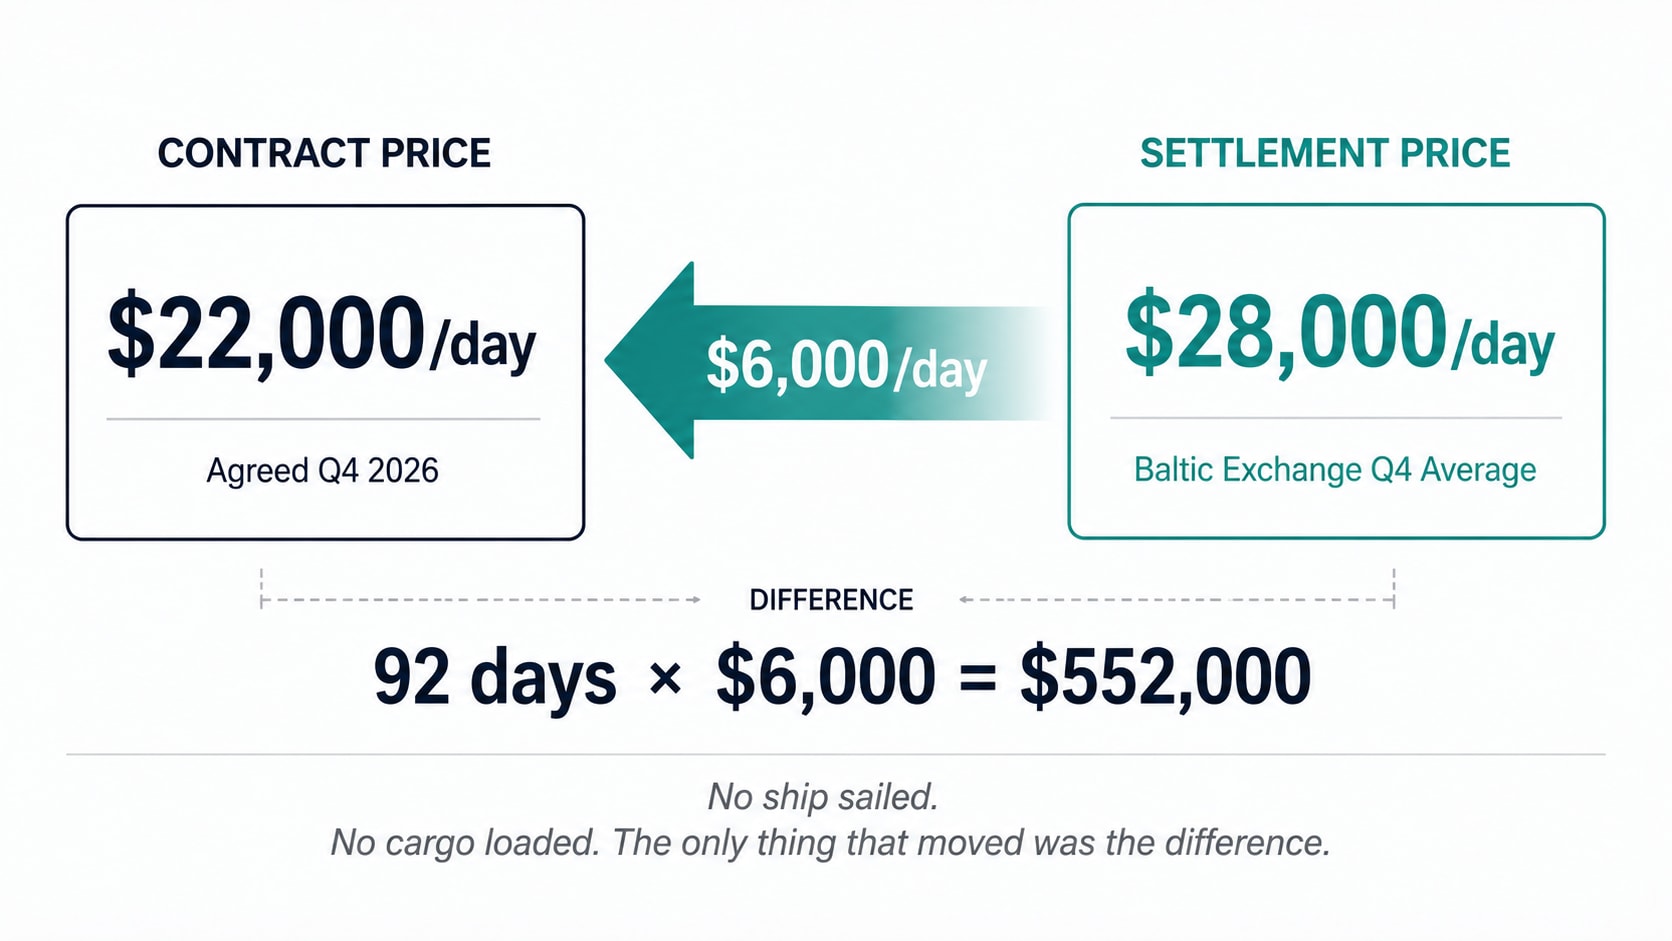
At expiry, the contract settles against the average of the Baltic Exchange's daily route assessments for the period. If the market was higher than the agreed rate, the seller pays the buyer. If the market was lower, the buyer pays the seller. Cash changes hands. No cargo moves. No vessel changes name.
Freight derivatives did not begin with FFAs. The first attempt was BIFFEX — the Baltic International Freight Futures Exchange — launched on the London International Financial Futures Exchange (LIFFE) in May 1985. BIFFEX was the world's first exchange-traded freight futures contract. It settled against the Baltic Freight Index, a composite of multiple dry bulk routes. The problem was that the composite index was too broad: a Capesize shipowner could not hedge a specific Pacific route because the index blended dozens of routes into a single number. Basis risk — the mismatch between the hedged position and the actual exposure — made BIFFEX ineffective for precise hedging. Trading volumes stayed low. In April 2002, BIFFEX was discontinued. FFAs had already emerged as the alternative in the early 1990s, offering route-specific contracts that matched how the physical market actually traded. By the mid-2000s, FFAs had fully replaced BIFFEX as the industry's hedging tool.
How it settles — a worked example
No ship sailed. The difference is the entire transaction.
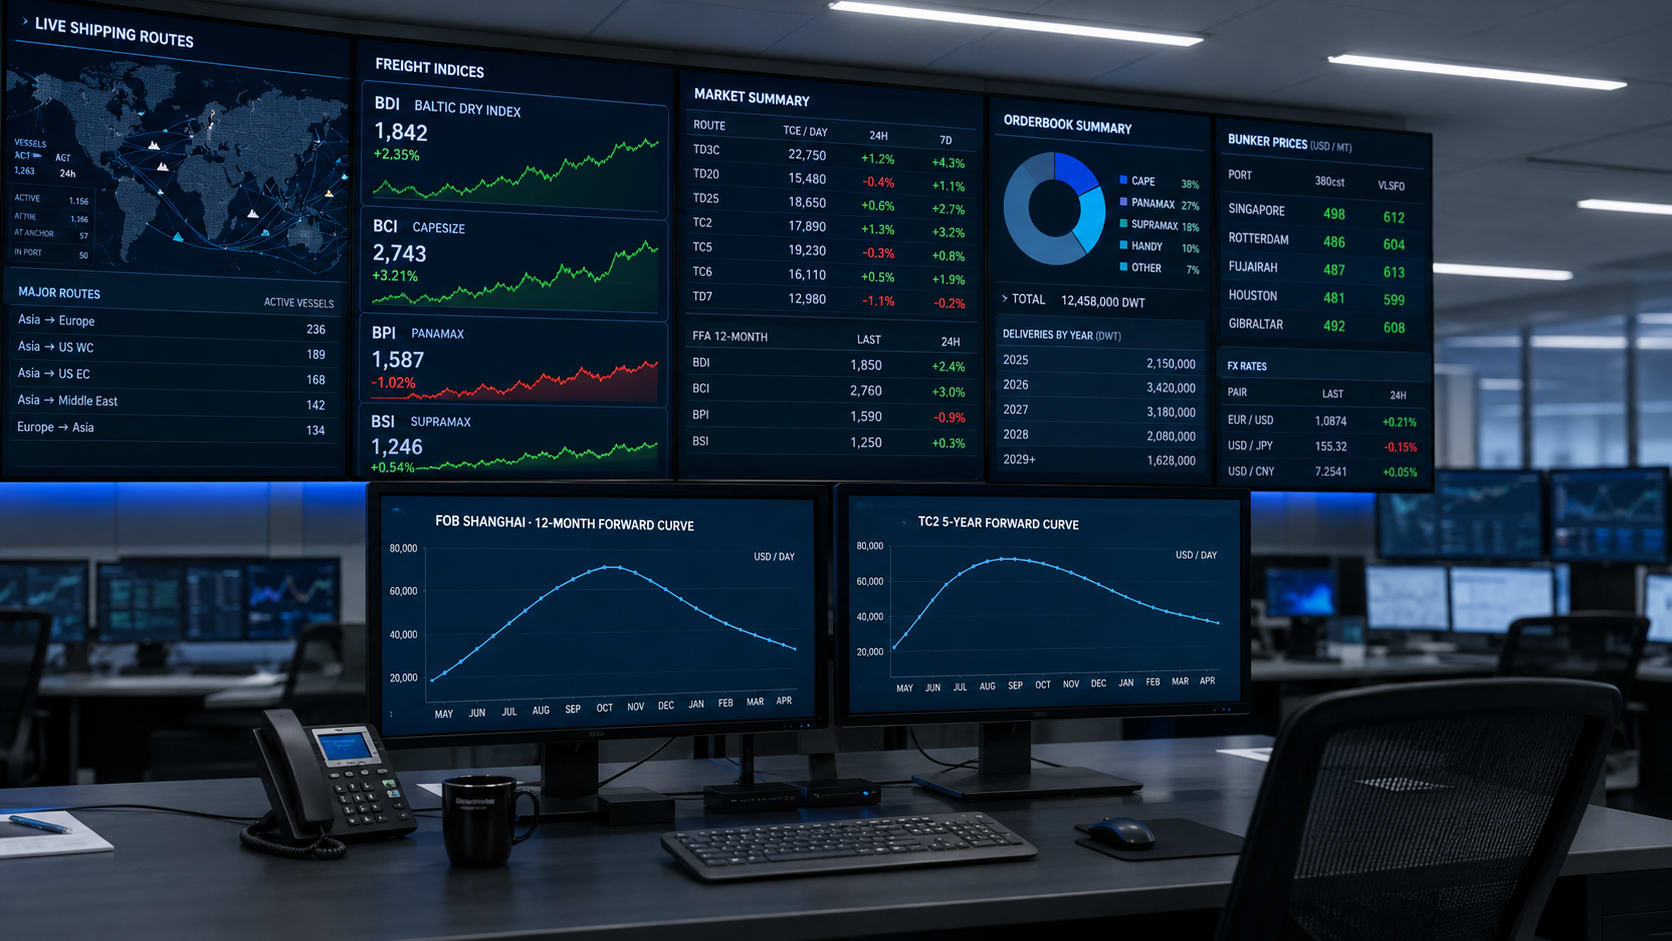
The settlement number comes from the Baltic Exchange, which publishes daily assessments for around 50 standardised routes across dry bulk, tanker, and container segments. These assessments — the BCI, BPI, BSI, BDTI, BCTI, and others — are the reference prices that the entire FFA market relies on. If a route's daily index is not published, no FFA can settle against it. This gives the Baltic Exchange a role in the derivatives market that goes far beyond its origins as a commercial shipping club.
FFA trading is conducted bilaterally between counterparties through brokers — the Forward Freight Agreement Brokers' Association (FFABA) coordinates the broker community — or through exchanges such as the CME Group and the Singapore Exchange (SGX), which offer cleared FFA products with central counterparty clearing. Cleared FFAs eliminate counterparty credit risk; bilateral OTC FFAs require ISDA master agreements and credit support annexes between the parties.
Who trades FFAs — and why
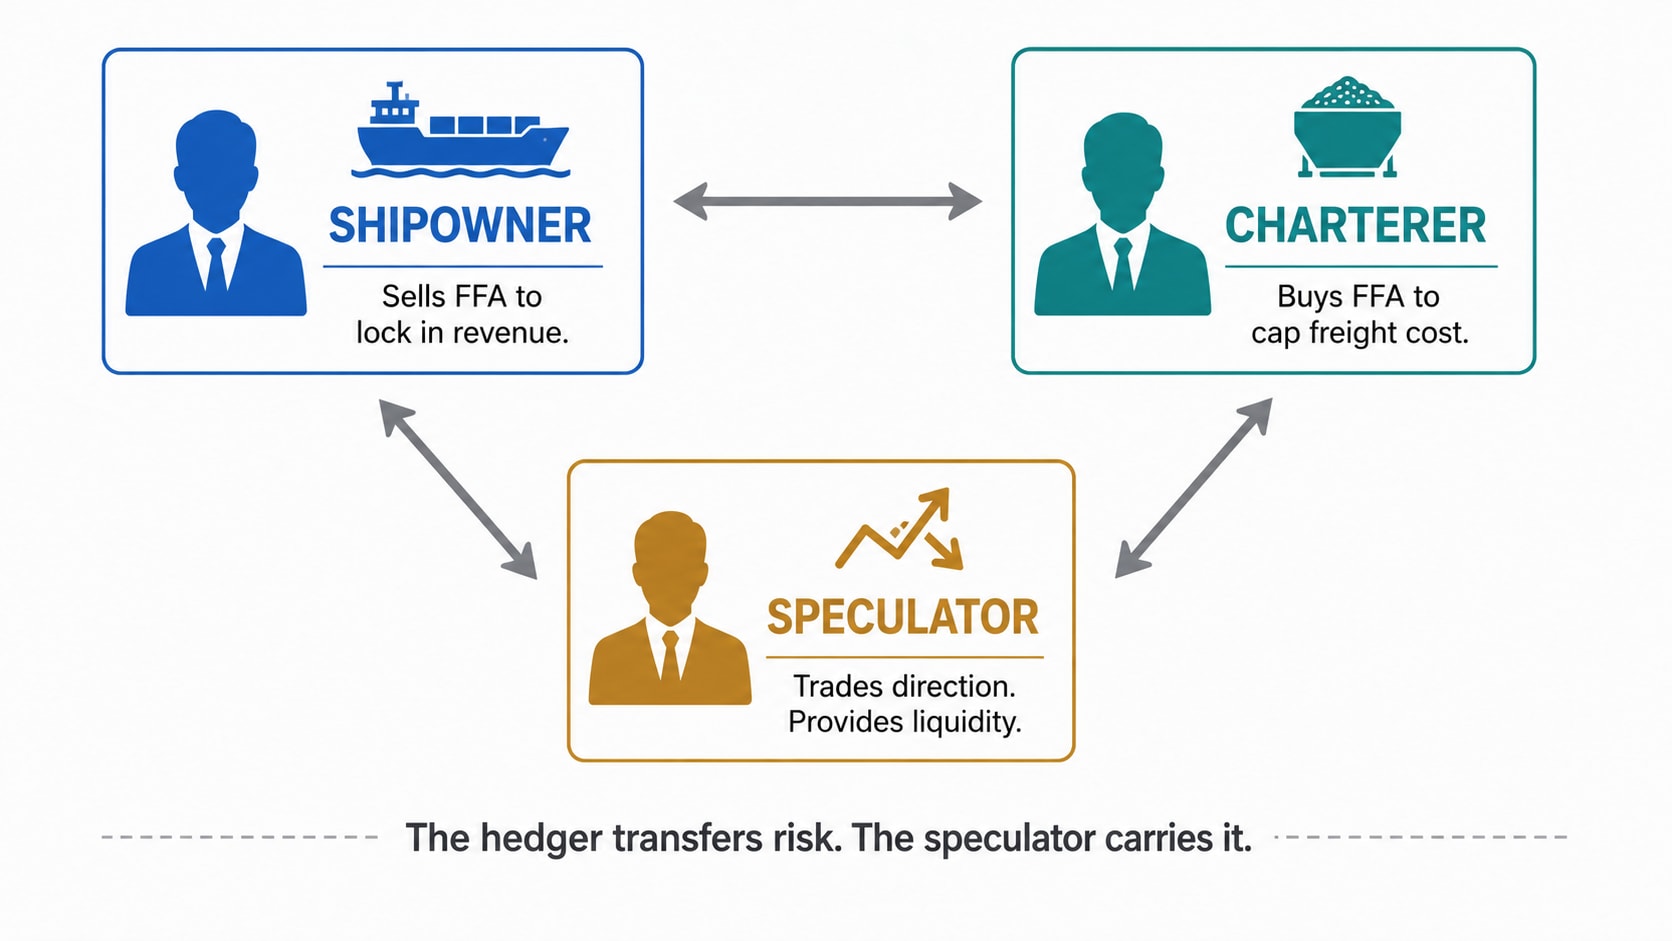
A Capesize shipowner with a vessel coming open in October wants to know she will earn at least $20,000/day for the quarter — enough to cover operating costs, debt service, and some margin. If she can sell an FFA at $22,000/day for October-December, she locks that in regardless of where the market goes. If rates spike to $35,000/day, she still receives only $22,000 net (plus the $13,000 physical surplus is offset by the FFA payout to her counterparty). If rates collapse to $14,000/day, she still receives $22,000 net.
A steel mill buying 12 shipments of iron ore next quarter faces the opposite problem: rate uncertainty is a cost risk. If the mill buys a Capesize FFA at $22,000/day, a rate spike is absorbed by the FFA gain — the extra freight cost in the physical market is recovered from the seller of the FFA. The shipowner and the steel mill have transferred risk between them without ever speaking directly.
The speculator — typically a commodity fund, a macro hedge fund, or a dedicated shipping derivatives desk — takes a view on where rates are going. Their participation matters because it provides the liquidity that makes the market function. Without speculators willing to take the other side, shipowners trying to sell FFAs and charterers trying to buy them would spend too long finding each other at prices neither would accept.
The dry bulk FFA market
The dry bulk FFA market is the oldest and most liquid segment. Routes include the Capesize time-charter average (C10), Panamax routes, Supramax and Handysize baskets, and the full suite of Baltic sub-indices that make up the BDI.
As of early 2024, open interest across all dry bulk freight derivatives reached approximately 727,000 lots — where one lot equals one day of hire on a single vessel. Average daily trading volume was approximately 12,400 lots for dry bulk. In 2021, dry bulk FFA volumes hit 2.5 million lots — up 61% on the previous year — with Capesize and Panamax contracts accounting for roughly 90% of underlying physical market flows. By global derivatives standards, the FFA market is small. By physical freight market standards, it is substantial — and growing.
The largest physical participants are iron ore miners and buyers (who drive Capesize demand), grain traders and agricultural commodity houses (who drive Panamax demand), and coal producers and utilities. All of them face freight exposure that materialises when the commodity price moves — but also independently of it, when shipping markets tighten for unrelated reasons such as port congestion, vessel shortages, or seasonal demand patterns.
The Baltic Capesize Index (BCI) and Baltic Panamax Index (BPI) are the settlement benchmarks for the dominant FFA contracts. Both are published daily and are the same numbers that feed into the Baltic Dry Index. The FFA and the physical market are therefore linked directly through the settlement benchmark — but they can diverge substantially over the course of a quarter as market participants update their views.
Tanker FFAs — and the 2026 turning point
The tanker FFA market is newer and historically less liquid than dry bulk, but it has been growing rapidly since 2020 as crude oil price volatility expanded the hedging need among refiners, oil majors, and tanker owners.
As of early 2024, tanker derivatives had approximately 145,000 lots of open interest, with average daily trading volume of approximately 3,400 lots. The primary settlement benchmarks are the Baltic Exchange's TD3C route (VLCC MEG to China, 270,000 tonnes) for crude and the TC2 route for clean products.
The Hormuz crisis of March 2026 accelerated tanker FFA participation sharply. When TD3C touched $424,000/day and Frontline reported Q2 2026 bookings at $181,700/day on 82% of vessel days, commodity traders, refiners, and shipowners who had never traded tanker FFAs before entered the market to hedge rate volatility that exceeded anything in 18 years. The result was a structural expansion of tanker FFA liquidity that is unlikely to reverse even if Hormuz normalises.
The TCE-based settlement system for tanker FFAs means the FFA rate and the physical voyage rate are connected through the same calculation a chartering desk uses every day. Understanding how TCE is calculated — stripping out voyage costs to produce a comparable daily earnings figure — is a prerequisite for interpreting tanker FFA prices.
Container FFAs and the FBX
Container freight derivatives are the newest segment. Rather than settling against Baltic Exchange assessments, container FFAs typically reference the Freightos Baltic Index (FBX) or the Shanghai Containerized Freight Index (SCFI). The underlying mechanics are identical to dry bulk FFAs, but the participants are different: ocean carriers, freight forwarders, large beneficial cargo owners, and commodity traders with container freight exposure.
The divergence between FBX and BDI in 2026 — container rates holding while dry bulk fell — illustrates why traders in each segment need separate hedging tools. An oil trader cannot hedge container freight exposure with a Capesize FFA, even if both markets are declining simultaneously for different reasons.
FFA and the physical charter party
A common source of confusion is how an FFA relates to a charter party. They are not the same document, and they serve different purposes.
A charter party is a legally binding contract for the use of a specific vessel. It names the ship, the cargo, the ports, the agreed freight rate or hire rate, and the terms under which the voyage or time charter will be executed. An FFA references no vessel, no cargo, and no port. It is purely a financial contract.
In practice, a shipowner may hold both simultaneously: a physical time charter that fixes a vessel to a charterer at $20,000/day for six months, and an FFA position that profits if the market rate moves above that level. The physical charter provides certainty of revenue; the FFA provides exposure to market upside that the charter contract has given away. This combination — known as a synthetic long — is a standard portfolio strategy for large shipowners.
Reading the forward curve
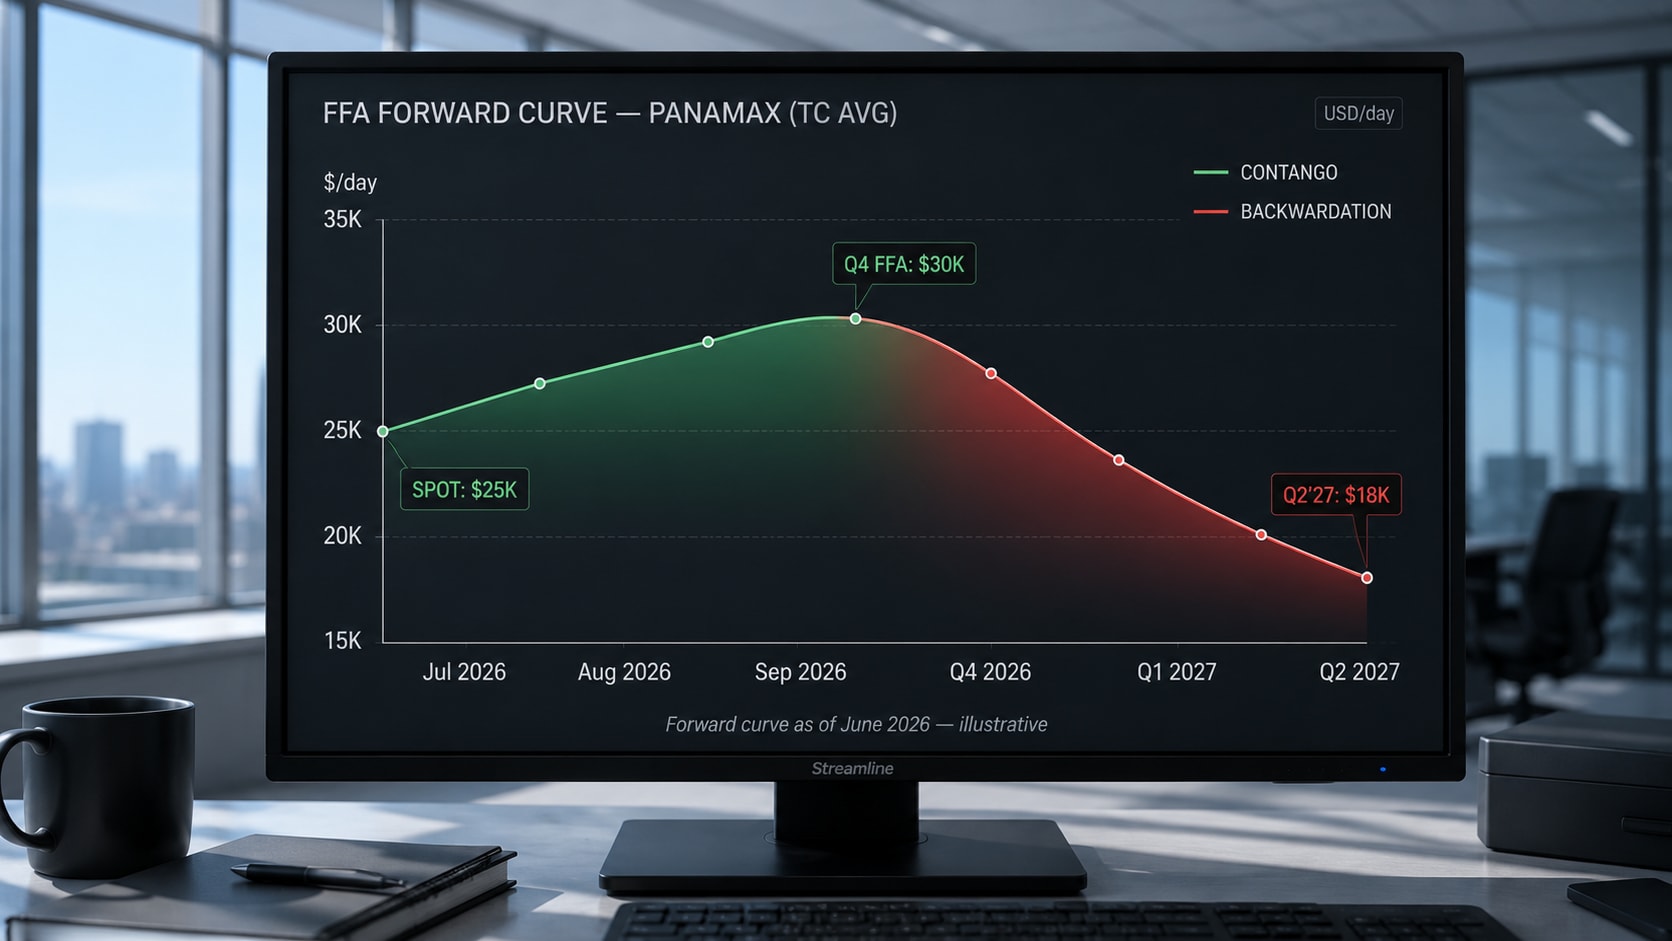
The sequence of FFA prices for forward periods — Cal Q3 2026, Cal Q4 2026, Cal Q1 2027, and so on — forms a forward curve. The shape of this curve carries information about market expectations in the same way that oil futures curves do.
When forward prices are above the spot rate (contango), the market expects conditions to tighten — either rising commodity demand, declining vessel availability, or seasonal factors. When forward prices are below spot (backwardation), the market expects the current tightness to relax.
In practice, neither the market nor the forward curve is consistently right. The FFA curve reflects the weighted average of participant views at the moment of trading — views that are updated continuously as new information arrives. What the curve cannot do is predict the outcome of a geopolitical event, a port congestion spike, or a weather disruption that has not yet happened.
After the March 2026 Hormuz closure compressed back toward the spot rate, the forward curve for VLCC FFAs reflected a market debating whether the structural tanker floor — driven by fleet ageing and lagging deliveries — would hold rates above $60,000–$80,000/day even without the geopolitical premium. The structural argument for a rate floor is separate from the crisis premium: even if the Strait reopens fully, the fleet dynamics that existed before the closure have not changed.
For anyone building a view on shipping markets, the FFA forward curve is the market's real-time verdict. It is incomplete, it is sometimes wrong by large margins, and it is always worth reading. You can track the live freight indices that feed FFA settlement on the Fairway ETA Data Hub.
What FFAs don't do
FFAs are a hedge, not an insurance policy. A shipowner who sells an FFA at $22,000/day and then finds her vessel sitting idle due to mechanical breakdown still earns nothing from the physical market — but she still owes the FFA settlement if rates rise. The financial and physical positions are separate, and a mismatch between them can turn a hedge into an additional loss.
FFAs also do not replace the need for a physical fixture. A charterer who buys an FFA to cap freight costs still needs to actually fix a vessel when the cargo is ready to move. If she cannot find a vessel — because the market is tight and all suitable ships are taken — the FFA gain does not substitute for the missing ship. The financial contract and the physical market operate in parallel, not as alternatives.
Finally, FFA prices diverge from physical market rates for extended periods. The basis risk — the difference between the FFA settlement rate and the rate the user actually pays or receives in the physical market — is a risk that every FFA user carries and must manage separately from the direction bet the FFA represents.
- Baltic Exchange — FFA settlement methodology and benchmark administration (2026)
- Breakwave Advisors — FFA market data, open interest, trading volumes (2024)
- Alizadeh & Nomikos, Shipping Derivatives and Risk Management (Palgrave Macmillan, 2009)