§1 — Nine Hundred Ships, One Number
The VLCC — Very Large Crude Carrier — is a vessel of 200,000 to 320,000 deadweight tonnes, typically 330 metres in length, capable of carrying approximately two million barrels of crude oil per voyage.
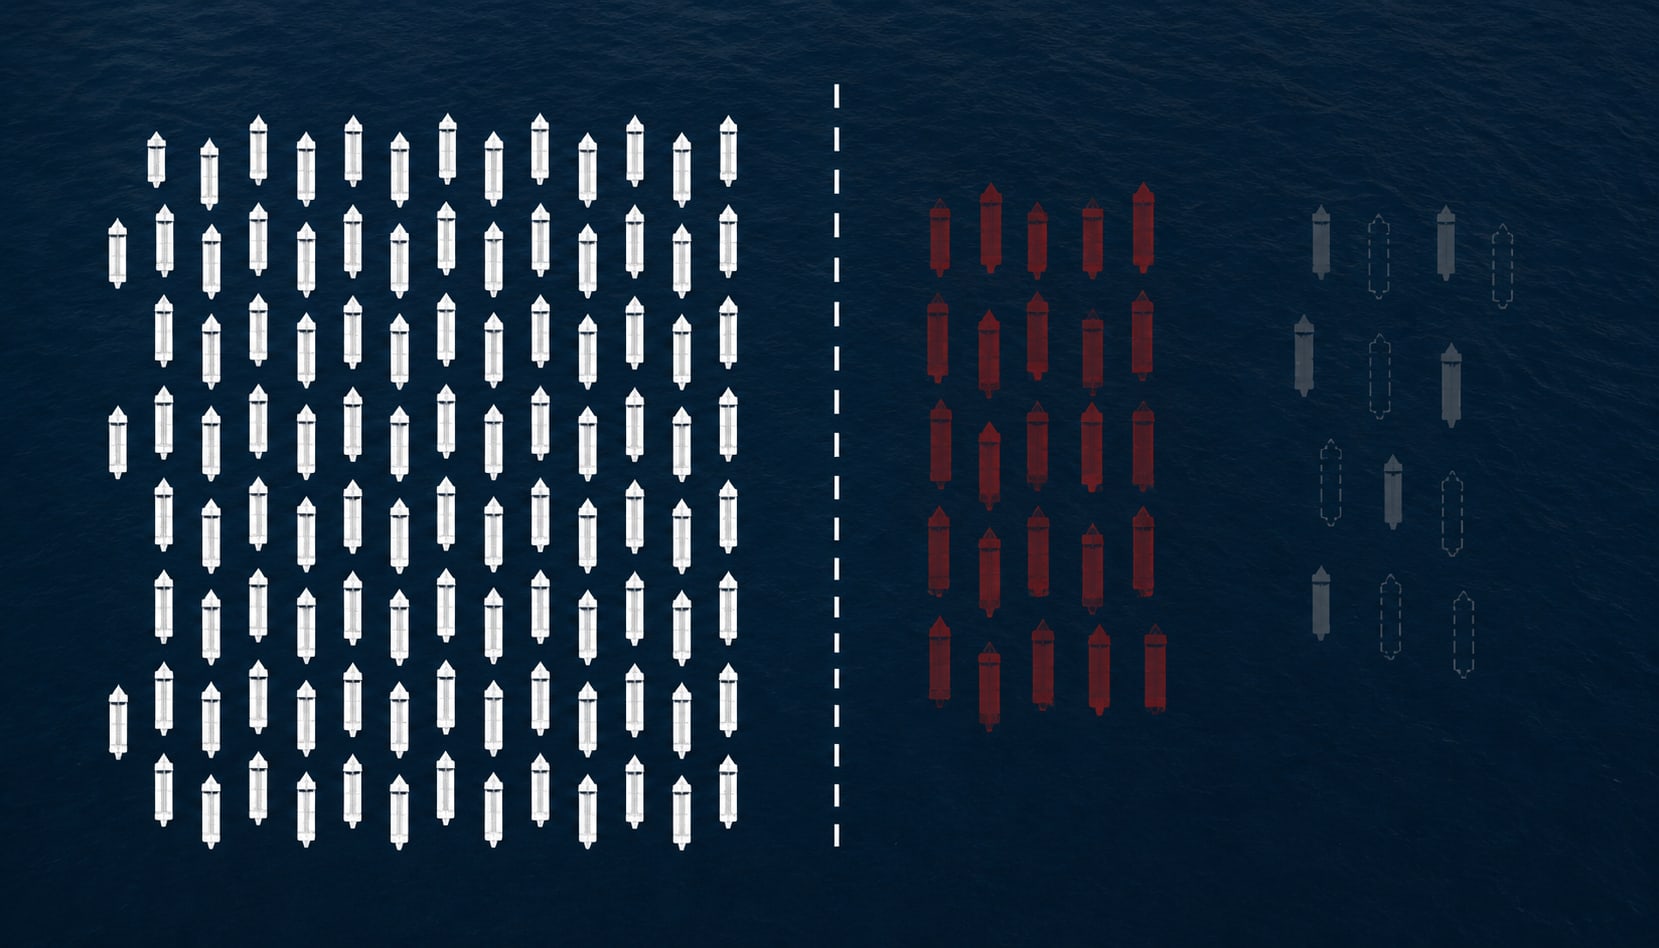
The global VLCC fleet numbers, depending on who is counting, somewhere between 890 and 920 vessels. That figure appears in fleet reports, is quoted by analysts, and sits at the top of every VLCC market update. It is also, in a meaningful commercial sense, wrong.
Roughly 200 of those ships operate in what the industry now calls the shadow fleet — vessels that carry sanctioned crude from Russia, Iran, and Venezuela, that have allowed their P&I cover to lapse or transferred to non-Western clubs, and that the major oil companies, their traders, and their charterers will not touch. They move cargo. They do not compete for mainstream fixtures.
Subtract those 200. Then subtract the 170 or more VLCCs over 20 years old — including those in shadow fleet trades — many of which are approaching the end of their commercially viable lives. On a net basis, accounting for overlap with the shadow fleet, this removes an additional 30 to 50 ships from mainstream consideration. Roughly 100 of those age-restricted vessels are formally sanctioned by OFAC or designated under related programmes. A similar number are technically in mainstream operation but find their trading options narrowing as vetting standards tighten and insurance requirements become more restrictive.
Add the ships that were operationally unavailable during the Hormuz disruption — stuck at anchor, stranded at terminals, unable to load or discharge — and the number drops further. The effective VLCC fleet available for mainstream commercial employment at any given moment is closer to 570 to 620 vessels. That 35% gap between the registered total and the tradeable reality is the single most important structural fact about the VLCC market in 2026.
§2 — The Orderbook That Arrives Late
In 2024, exactly one new VLCC was delivered worldwide. One. Think of the analogy: if a city has 900 apartments and has been adding 40 new units a year for decades, and then suddenly builds one — the market does not stay balanced. The price moves.
In 2025, five VLCCs were delivered. The historical average since 2000 has been approximately 40 per year. Tankers International estimates that the global orderbook, which has been recovering since its 2023 low, contains approximately 60 vessel equivalents over the next five years. That sounds like recovery. It is not. Against a fleet that ages continuously, against shadow fleet attrition, and against rising demand, the math produces effective fleet growth of approximately 1% per year over the next three years, against a nominal increase of 8%.
The nominal fleet is growing. The effective supply is not. The secondhand VLCC premium — trading at 2.4 times the long-run median in early 2026 — is the market pricing that gap in real time.
§3 — Why No One Is Building Faster
If the market needs more VLCCs, why aren't yards building them? The answer is that they can't — or more precisely, they've chosen not to.
Globally, only 13 shipyards currently have tanker orders on their books. Korean yards — which built the majority of the world's VLCC fleet for three decades — have decisively shifted their capacity toward higher-margin segments. An LNG carrier commands $250 million or more. A VLCC commands $110 to $130 million. Korean yards are full, and their queues are filling with LNG carriers and containerships. Hyundai, Samsung, and DSME are not taking meaningful VLCC orders because they don't need to. The margin differential is too large.
Chinese yards have capacity, but owners placing orders there face a different problem: the fuel technology question. Whether future VLCCs should be ammonia-ready, methanol-capable, or LNG-fuelled remains unresolved commercially. A ship ordered today commits capital to a fuel choice that may be the wrong one by 2030. Owners hesitate. Lead times for a VLCC ordered now run to late 2028 at the earliest. The supply response, if it comes, is three years away.
§4 — The Sinokor Variable
Tankers International is the longest-running commercial pool in the VLCC sector, formed by a group of major owners to pool spot market tonnage and improve utilisation. At its peak it controlled approximately 15% of the spot-trading fleet — a figure that gave it pricing influence and made it a reliable reference point for the market. That era ended.
The shift started quietly. By 2024, several platforms were each controlling 12 to 13% of the VLCC spot-trading fleet independently — COSCO, Frontline, and a Korean name that most Western market participants had not tracked closely: Sinokor Merchant Marine. In 2025, a new platform surpassed 20% for the first time. Lucky Maritime, backed by Chinese capital, became the first commercial platform to exceed that threshold — a milestone noted by Breakwave Advisors and Signal Ocean as the beginning of a structural concentration shift.
Then came January 2026. In a single month, Sinokor accounted for 35 of 45 VLCC sale-and-purchase deals globally — over $2.5 billion in transactions. The counterparties read like a who's who of major Western owners: Frontline sold eight VLCCs for $832 million. CMB.TECH and Euronav sold six for approximately $525 million. Zodiac Maritime sold three. International Seaways sold two. Dynacom sold 12 to 13. In each case, the buyer was Sinokor or entities acting on its behalf.
The vessels acquired were not random. The majority were 2010 to 2016 vintage — deliberate selections offering a balance of compliance tractability and remaining commercial life. Gibson Shipbrokers estimated that Sinokor paid a 10 to 15% premium above prevailing valuations to secure the tonnage.
The question every market participant was asking was: who is backing this? The answer arrived in March 2026, when Bloomberg reported that MSC — the world's largest container shipping company, controlled by Gianluigi Aponte — had acquired a 50% stake in Sinokor Maritime. The tanker buying spree, it turned out, had been backed by container money all along. Sinokor now controls roughly 24% of the VLCC spot-trading fleet — a concentration the market has never seen from a single independent operator.

§5 — Where the Fleet Goes From Here
The freight market has already moved. The TD3C route — the VLCC benchmark from the Middle East Gulf to China — traded in a range of $22,000 to $38,000 per day through most of 2024 and into the first half of 2025. By the second half of 2025, average earnings had risen to $70,750 per day. Year-to-date in 2026, the average stands at $95,922 per day.
That trajectory reflects both the supply constraints described above and a demand picture that has not weakened. On 18 February 2026, DHT Holdings fixed a one-year time charter at $90,000 per day — a rate that would have been considered extraordinary twelve months earlier. Another VLCC fixed at approximately $100,000 per day on a similar term. Owners who held tonnage through the 2023-2024 drought are now extracting the premium the market owed them.
The demand side has its own structural support. Hormuz rerouting — where cargoes that would have moved through the strait are now taking longer alternative routes — adds ton-mile demand directly. Energy transition is adding a different kind of demand: LNG carrier requirements are rising sharply, and the yards building those ships are the same yards that would otherwise have built VLCCs. The competition for shipyard slots is itself a supply constraint.
Major Asian importers — Japan, South Korea, Taiwan — source 60 to 70 percent of their crude from the Middle East. All are contracting with US, Brazilian, and Guyanese producers to reduce that concentration. But those sources are further away. A VLCC voyage from the US Gulf to Northeast Asia is roughly twice the distance of one from Ras Tanura. Diversification does not reduce oil dependency. It increases ton-mile demand — and with it, the need for more vessels sailing longer routes.
The structural picture is not complicated. The effective fleet is smaller than the registered fleet. Deliveries have been near-zero for two years. The orderbook recovery is real but insufficient to close the gap before 2028 at the earliest. Demand is stable and ton-mile adjustments are adding to it. One operator now controls a quarter of the spot-trading fleet. Nine hundred ships is not enough. That is the arithmetic.

- Tankers International, VLCC Fleet Profile and Effective Supply Analysis (April 2025)
- Breakwave Advisors / Signal Ocean, “VLCCs — Entering the Sinokor Era” (February 2026)
- Veson Nautical, VLCC S&P Transaction Analysis (January 2026)