Posidonia 2026 in Athens ran from June 1 to June 5. By the time the exhibition closed, the contract table looked like this.
June 1: Greece's Dynacom Tankers signed for twelve very large crude carriers at Hudong-Zhonghua Shipbuilding in Shanghai. Reported value around 10 billion yuan — roughly 1.47 billion US dollars. Each vessel at 307,000 deadweight tonnes. Same day, Aegean Shipping Management placed its first-ever VLCC order — two VLCCs plus two LR2 tankers at Hengli Heavy Industries.
June 2: COSCO Shipping Energy signed for four 175,000 cubic metre LNG carriers at Jiangnan Shipyard. Contract value around 953 million US dollars. Delivery between 2029 and 2030. Seven-year time charter to Shell Tankers Singapore attached.
June 4: DHT Holdings returned to Hanwha Ocean in South Korea for another VLCC newbuild.
Roughly four billion dollars in newbuild commitments in five working days. Each contract took a slot at a specific yard. Each slot taken was a slot that some other shipowner, in some other sector, now cannot have.
The capacity is geographically concentrated
Roughly 86% of global shipbuilding output comes from three countries: China, South Korea, and Japan. In the first quarter of 2026, Chinese yards captured 70% of global new orders. South Korean yards took 20%, supported almost entirely by their dominance in LNG carrier construction. Japanese yards took 1% — the lowest quarterly share on record since at least 1996. Three countries that together build nearly everything, and one of them is now functionally absent from the contracting table.
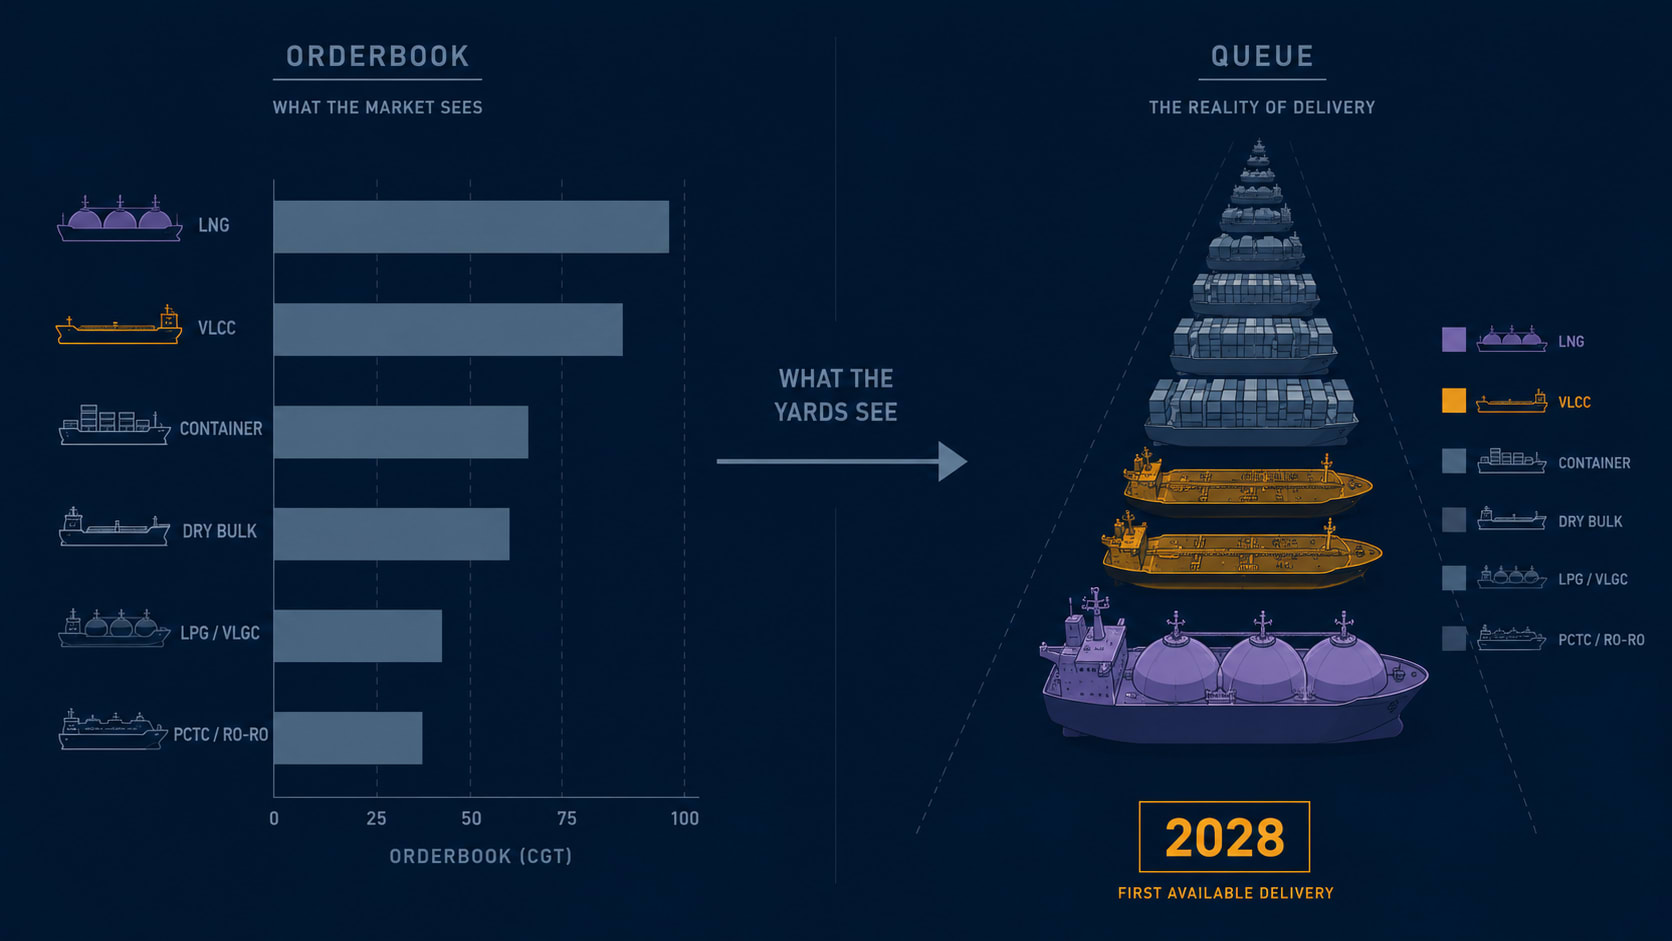
The total global orderbook stands at around 191 million compensated gross tonnes — about 17% of the current world fleet. That ratio has not been this high since 2011. First-quarter contracting in 2026 reached 17.6 million CGT, up 40% year on year. BIMCO estimates that contracting activity in the current decade is running 47% above the average of the previous decade.
Those numbers describe the demand side. The production infrastructure available to absorb that demand — the physical docks, cranes, steel-processing lines, and classified workers that turn orders into ships — has not scaled anywhere close to the same rate.
Yard Switching Cost — the hidden parameter
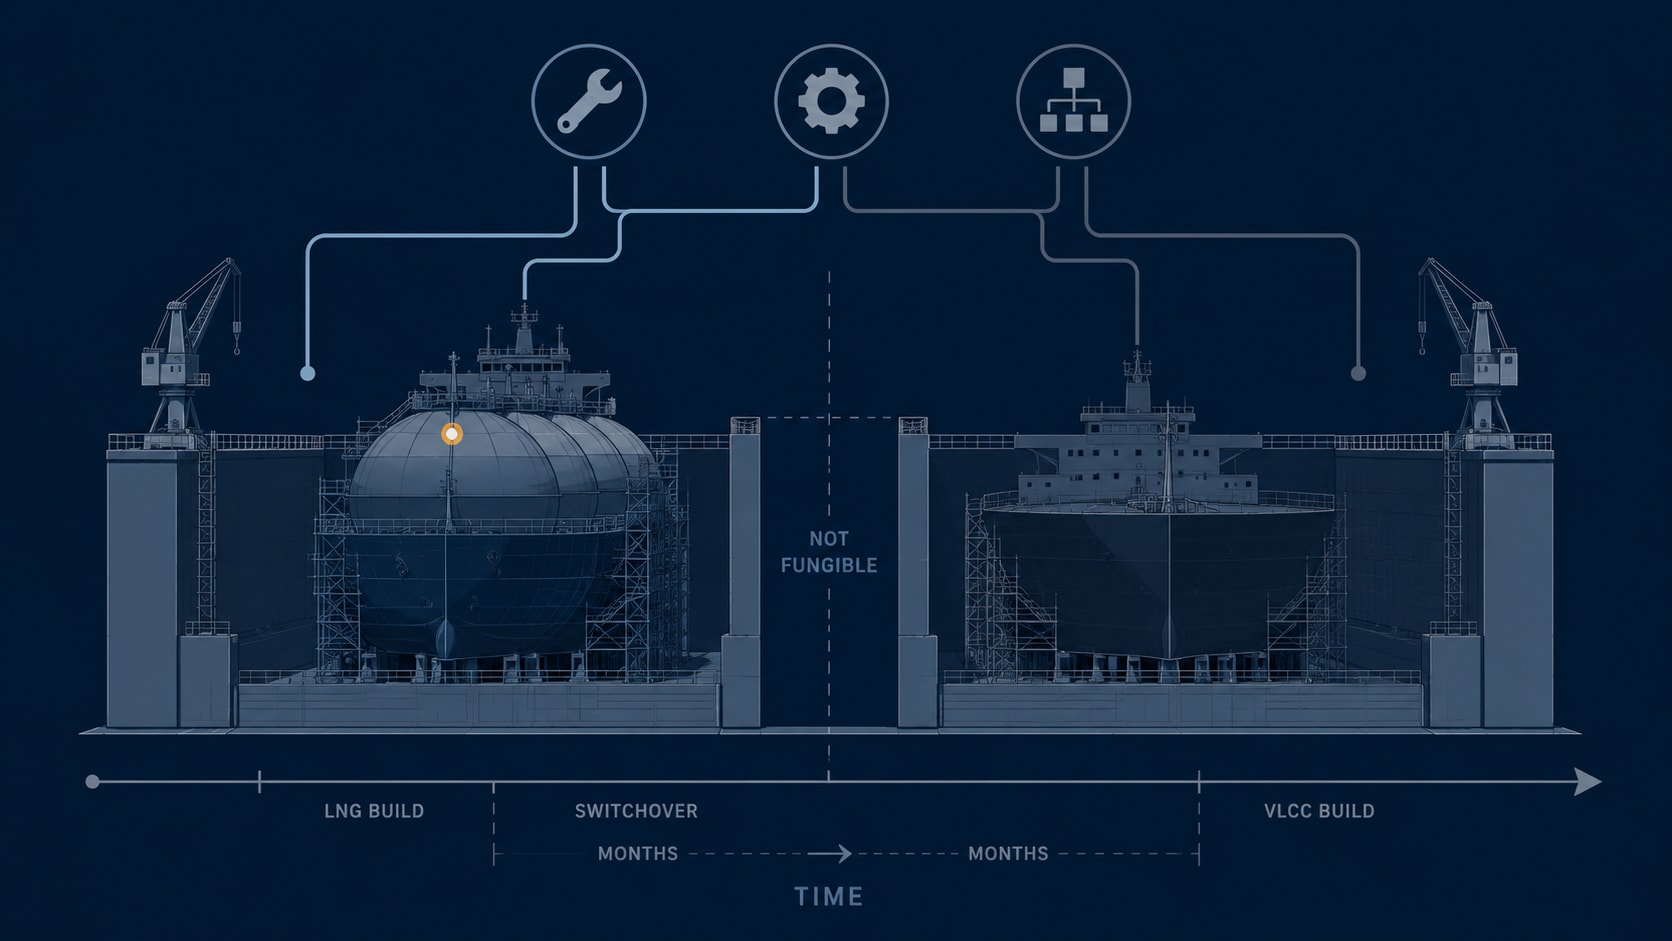
A dry dock looks, from the outside, like a generic industrial asset. In practice, each dock carries what might be called a Yard Switching Cost — the operational, regulatory, and supply-chain cost of moving from one vessel type to another within the same facility.
The dock that builds a 174,000 cubic metre LNG carrier is configured for membrane containment system installation, dual-fuel engine integration, and the specific lifting equipment required for cargo tank assembly. The dock that builds a 300,000-deadweight-tonne VLCC is configured for different cargo-system steelwork, different hull-block assembly dimensions, and different cathodic protection systems. The worker expertise, the subcontractor network, the steel-cutting schedule, the classification approval pathway — all of it has been built around one set of ship types over years or decades.
For an LNG-specialised yard to retool for high-throughput VLCC production, the effective output loss during transition is estimated at roughly 18 to 24 months. For a container-focused yard to enter LNG carrier construction — including the classification approval pathway — the switching cost is closer to three years. These are not hypothetical numbers. Hudong-Zhonghua, the Shanghai-based yard that just signed for Dynacom's twelve VLCCs, has spent two decades building LNG carriers and container ships. The Dynacom VLCC order is the yard's first major VLCC programme at this scale. The yard is absorbing a real switching cost to take that contract, and the LNG and container slots it might otherwise have filled with familiar work are now occupied by something the yard has never built before.
Yard Switching Cost is the hidden parameter behind every orderbook headline. Supply forecasts that ignore it overstate the industry's ability to respond to demand signals. A yard that could theoretically build VLCCs but has spent fifteen years building LNG carriers does not become a VLCC producer overnight. The switching cost means the fleet composition of the world's merchant ships in 2030 is being shaped not by what the market wants, but by what each yard is already configured to make.
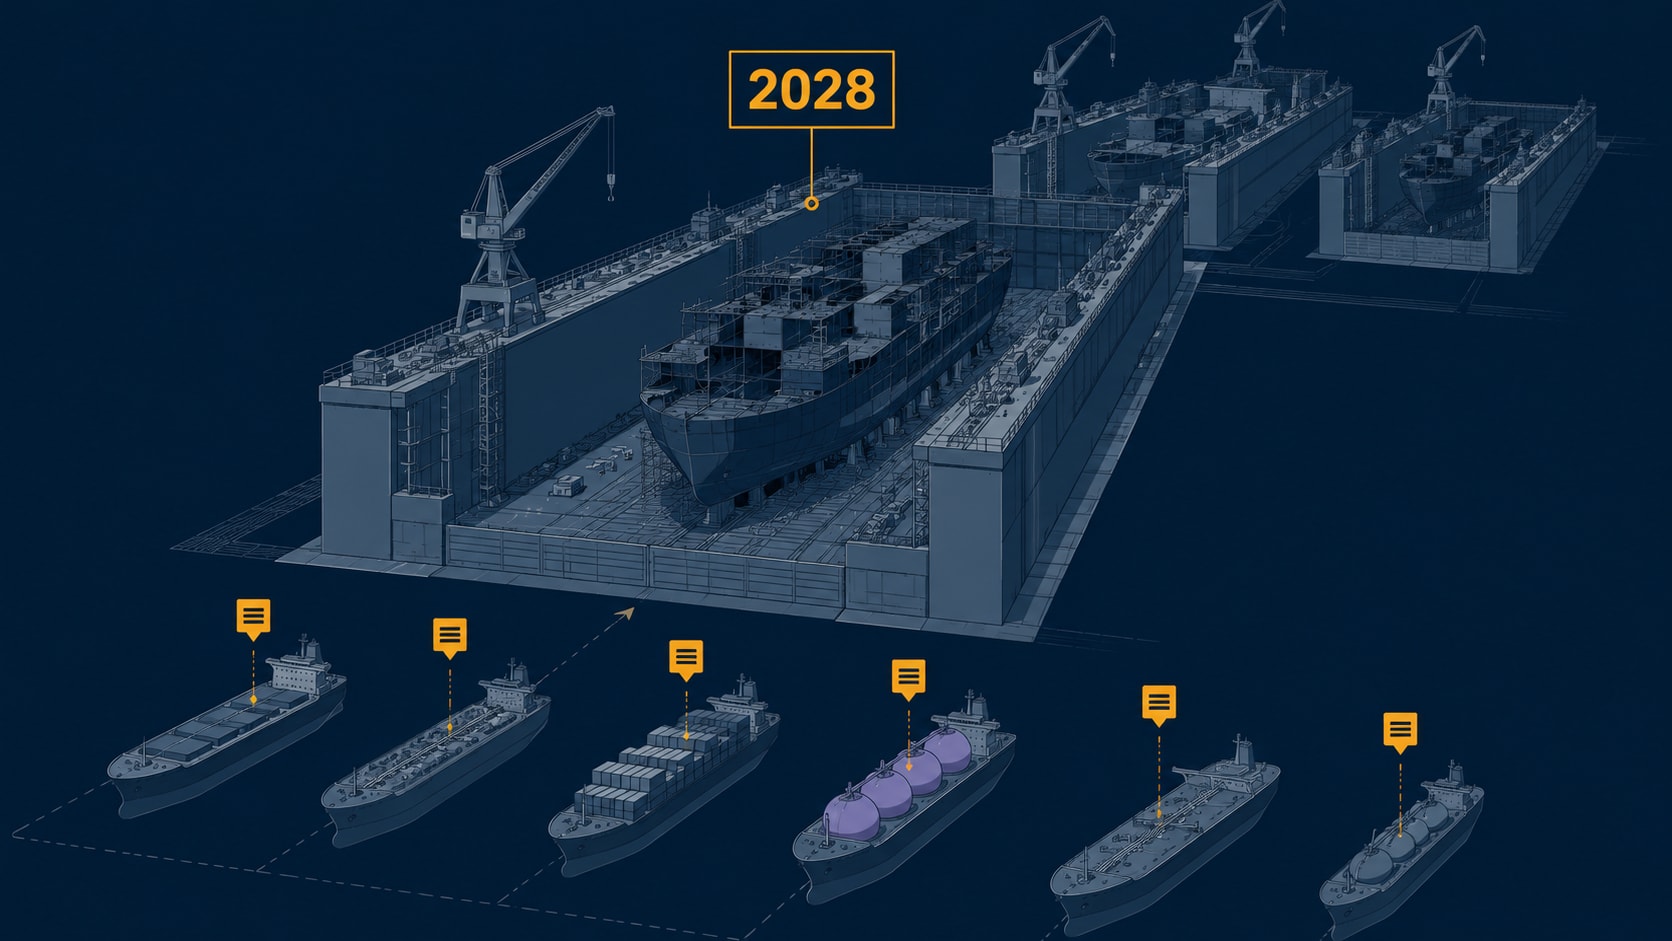
The production calendar is spoken for through 2028
The average delivery lead time for a new tanker order is now approaching three years. For containerships, about 3.2 years. For LNG carriers built in Chinese yards, closer to 4.8 years. For LNG carriers at Korean yards, around 3.5 years. All of these figures have been rising since 2020.
The production calendar at the major yards tells the story. The large Shanghai-based CSSC facilities — Hudong-Zhonghua, Jiangnan, Waigaoqiao — carry order books stretching into 2028. The Korean Big Three — HD Hyundai, Hanwha Ocean, Samsung Heavy Industries — have their 2027 calendars dominated by LNG carriers and ammonia carriers contracted in 2023 and 2024. A smaller number of privately owned Chinese yards, including Hengli Heavy Industries, still have earlier availability, which is one reason Greek owners have been competing aggressively for slots there. But even at Hengli, the calendar is filling fast.
An order signed in mid-2026 will, for most major yards, produce a ship in 2029 or 2030. The supply that will arrive in 2027 and 2028 was decided years ago. It is no longer a variable. It is a calendar entry.
The infrastructure that was not rebuilt
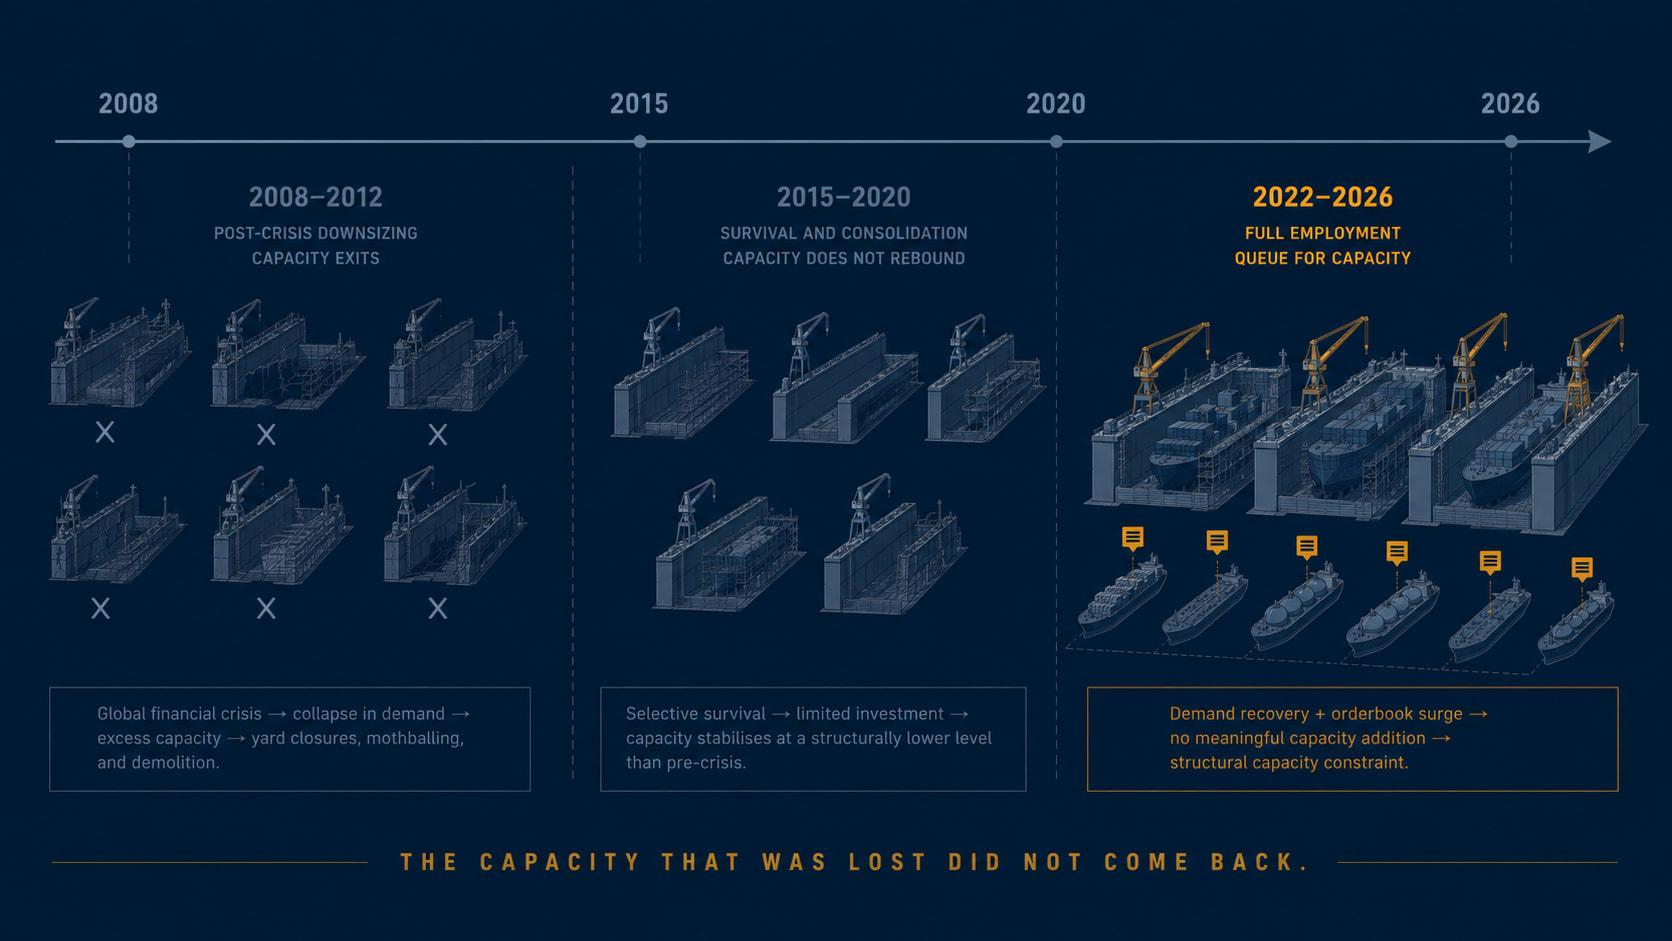
The yards that survived the long recession after 2008 made a deliberate decision. They did not rebuild the dock capacity that had been retired, mothballed, or sold to other industries during the downturn years. The economics at the time did not justify it. By the time demand recovered in earnest — 2021, 2022, and accelerating through 2024 — the installed dock footprint was structurally smaller than it had been at the peak of the prior cycle.
The result is an industry where demand is running 47% above the prior decade's average through a production base that was deliberately shrunk during the previous downturn. Construction of new dock capacity is theoretically possible but operationally slow. A greenfield dry dock typically requires four to six years from breaking ground to first ship delivery — site preparation, marine works, crane installation, supply-chain establishment, classification approval, workforce training. HD Hyundai is currently leasing dock capacity at Subic Bay in the Philippines to extend its effective output. Korean yards have discussed overseas partnerships in Vietnam and India. None of these add capacity in 2026 or 2027.
The constraint is not temporary. It is the structural consequence of a capacity decision made during the 2010s that cannot be reversed on the timeline the current market requires.
Sector by sector — who is losing slots to whom
The cross-sector competition for yard capacity plays out differently in each segment, but the mechanism is the same: every high-value slot a yard allocates to one vessel type is a slot some other type does not get.
LNG carriers are the highest-priced product per slot — roughly $215-220 million for a Korean-built 174,000 cubic metre vessel, around $200-210 million from a Chinese yard. Korean yards prioritise LNG carrier slots because the margins and charter attachments are the strongest in the orderbook. That priority is what maintains Korean LNG construction share at 70-75% of the global orderbook even as Chinese yards have built four capable LNG facilities over the past four years. When LNG orders at Korean yards expand, the slots available for VLCCs and other tankers at those same yards contract.
VLCCs are the clearest case of slot displacement pricing. A ten-year-old VLCC was trading at roughly $117 million in mid-2026 — about 2.5 times its long-run median price. The secondhand premium is the market's way of pricing the production calendar. Buying an existing VLCC is, in practical terms, faster than ordering a new one and waiting for 2029 delivery.
Container ships sit on the longest forward orderbook in absolute terms. The orderbook-to-fleet ratio is around 31.6%, with deliveries of roughly 2.1 million TEU in 2025, 1.7 million in 2026, then 2.8 million in 2027 and 3.5 million in 2028 (Clarksons Securities estimates). The 2026 slowdown is a production calendar artefact — a gap between the pandemic-era orders rolling off and the next wave arriving — not a demand signal. The 2027-2028 wave is already contracted. Whether it arrives on schedule is a separate question, and the answer, historically, is that it usually does not.
Bulk carriers are quietly exposed. Chinese yards dominate bulk construction, but the same yards are increasingly reallocating slots toward higher-margin container ships, tankers, and gas carriers. Japanese yards, which historically held about a quarter of the bulk carrier orderbook, are consolidating and exiting lower-value segments. The headline bulk orderbook may not translate into on-time deliveries at the scale the numbers imply.
Queue economics versus forecast economics
There are two pricing logics operating in the same industry, and they produce different answers about the future.
Forecast economics is what the freight market uses. It assumes new tonnage will arrive in proportion to demand signals — the spot rate model. Container freight projections for 2026-2028 are built around expected vessel deliveries at specific volumes. Tanker rate forecasts assume newbuild supply will arrive on a roughly two-to-three-year horizon after the order is placed. The logic is that supply responds to price, with a lag.
Queue economics is what the yards operate under. New tonnage arrives in the order it was contracted, regardless of the demand signal that emerged afterward. A yard that committed a dock slot to a container vessel in 2024 will deliver that container vessel in 2027 whether the container market is booming or collapsing at the time of delivery. The slot does not reallocate itself based on where freight rates are highest. The queue is first-in, first-out, and once a slot is spoken for, it is gone.
In a market where yard capacity is abundant, the distinction does not matter much. Supply roughly follows demand. In a market where yard capacity is the binding constraint — where every major production facility is spoken for through 2028, where switching costs prevent rapid reallocation between sectors — queue economics dominates. The freight market that does not adjust for that structural condition gets mispriced. Container delivery forecasts assume on-time arrival. LNG charter rates are underwritten by Korean slot scarcity. VLCC secondhand values at 2.5 times median reflect the market pricing production calendar reality rather than forecast assumptions.
The two logics will converge again when yard capacity loosens. That loosening requires either a demand collapse or a multi-year expansion of dock infrastructure. Neither is imminent in mid-2026.
The signal — yard allocation as a 36-month leading indicator
For anyone trying to anticipate freight market direction from outside the chartering desk, the composition of new orders at the major yards — not the global orderbook total — is the signal worth watching.
When Korean Big Three monthly order announcements skew 75% or higher toward LNG and gas carriers, VLCC freight tightness 36 months later is being locked in. The tanker supply that will not arrive in 2029 is decided by the LNG orders that took the slots in 2026. When Chinese major-yard announcements skew toward container ships and VLCCs, bulk carrier supply for 2029-2030 is being compressed. The slots that bulk carriers did not get are the supply that will not exist.
The second signal is the secondhand-to-newbuild price ratio by vessel type. When secondhand values approach or exceed newbuild prices — where VLCCs are sitting in mid-2026 — the market is pricing the production calendar directly. That ratio will compress only when the contracted deliveries begin to arrive. Until then, the premium is structural.
The third signal is the forward delivery year of new contracts. When yards sign orders almost exclusively for 2029 and 2030, the production calendar is full. When 2027 and 2028 slots begin to appear in new contract announcements, the constraint is easing.
The global orderbook is a forecast by convention. It is a production calendar in reality. The distinction matters because the freight market prices supply on forecast assumptions — on time, on schedule, in the right sector. The yards build on calendar constraints — in the order contracted, with the Switching Cost baked in, subject to the physical limitations of what each dock can produce.
In a capacity-constrained market, the calendar wins. The yards cannot build two things at once. And in mid-2026, the calendar is spoken for.
For more on the supply-side dynamics shaping commercial shipping, see our analysis of Where Are We in the Shipping Cycle? and our companion pieces on Charter Parties Explained, What Is Worldscale?, and What the Baltic Dry Index Tells You.